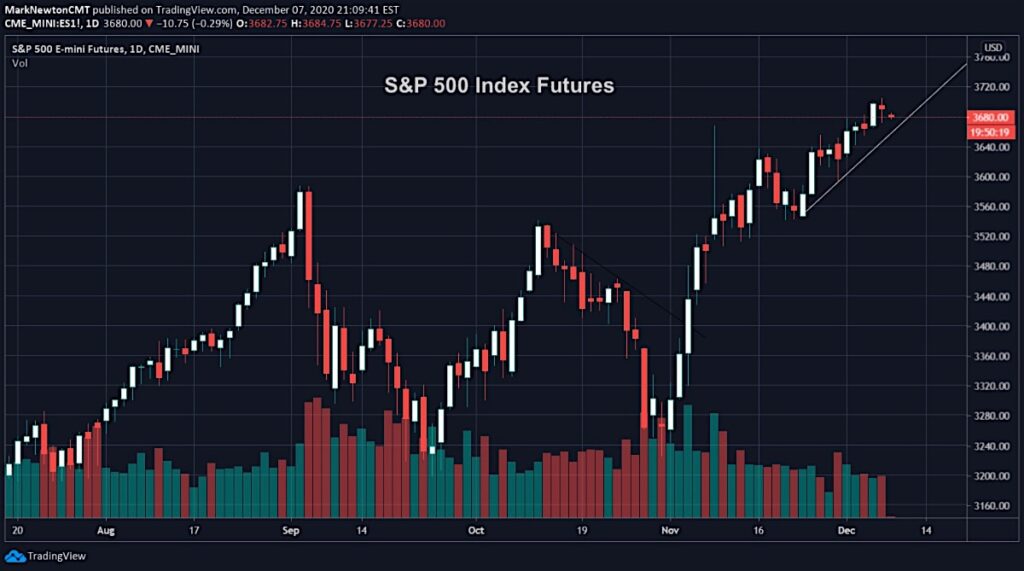
Monday’s stock market pullback saw the S&P 500 Index find support and stabilize above last Friday’s lows.
Until the S&P 500 makes multi-day lows or breaks its current short-term trend line (higher) from late October further gains look possible into mid-December.
The two-day pullback appears to be minor and upside should run to 3710-3720 (barring an immediate breakdown below the sharp up-trend line higher). Momentum remains positively sloped and trends have not been broken from late October. That said, traders should watch this trend-line.
If you have an interest in seeing timely intra-day market updates on my private twitter feed, please follow @NewtonAdvisors. Also, feel free to send me an email at info@newtonadvisor.com regarding how my Technical work can add alpha to your portfolio management process.
Twitter: @MarkNewtonCMT
Author has positions in mentioned securities at the time of publication. Any opinions expressed herein are solely those of the author, and do not in any way represent the views or opinions of any other person or entity.


