Investors had a rock and roll week, as the stock market sold off and then recovered, as I pointed out in the latest askSlim Market Week show.
In all, the S&P 500 Index rose 18 points last week to 2970, an increase of 0.6%.
The stock market was down on Monday and Tuesday last week on news that the Trump administration had blacklisted 28 Chinese firms for human rights abuses.
However, the market rebounded on Thursday and Friday as the US and China showed progress on a less ambitious “phase one” trade deal.
Let’s look at the chart. Our approach to technical analysis uses market cycles to project price action.
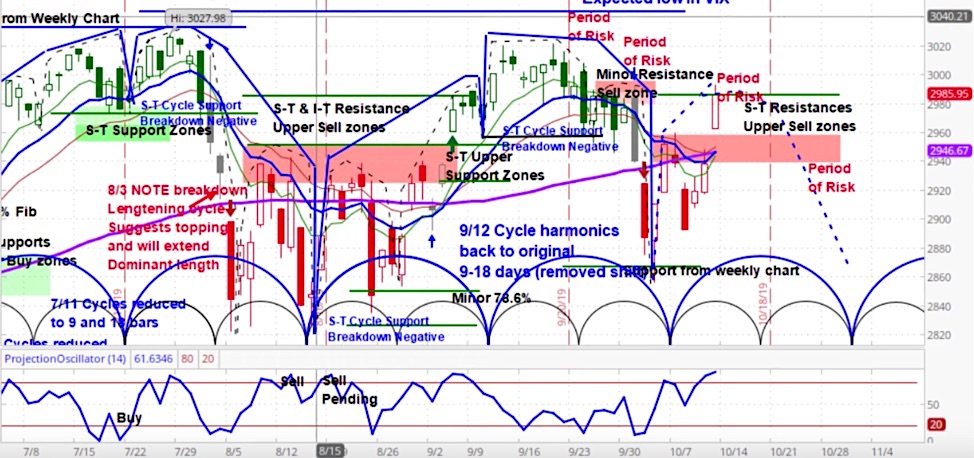
Our analysis is for the S&P 500 Index to begin to roll over, within the context of its current minor cycle. While last week’s rally is noteworthy, the SPX was unable to convincingly break through short term resistance.
This lack of conviction suggests our “period of risk” towards the end of this month is still in play, as shown on the chart above.
S&P 500 (SPX) Daily Chart
For a more detailed analysis of both of these charts, check out the latest episode of the askSlim Market Week show.
Twitter: @askslim
Any opinions expressed herein are solely those of the author, and do not in any way represent the views or opinions of any other person or entity.


 Ready To Break Out?")
 Rolling Over At Key Fibonacci Level?")

 Ready To Break Out?")
