The S&P 500, Nasdaq 100, and Nasdaq Composite recently came down to the MOB price target support bands and reversed back up. This looks like the makings of another bear market rally.
These bear rallies can be fast and furious… and very short-lived. Some last as few as 2-3 days while others last a couple of weeks like we saw in mid-May. The latter bear rally resulted in a +10% bump.
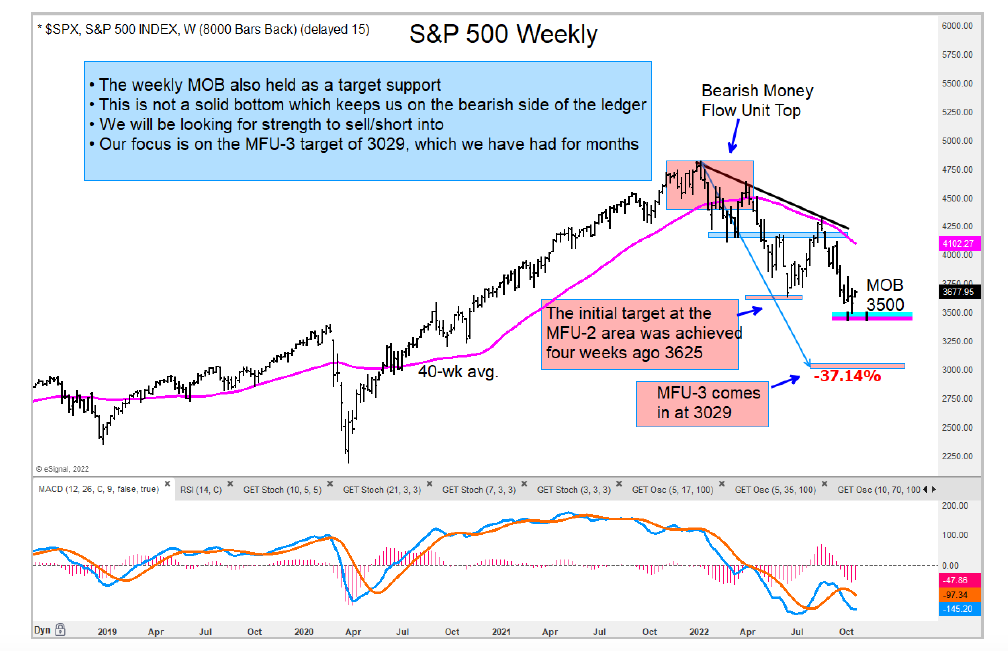
That said, we prefer to stay focused on the big picture “weekly” timeframe and play the long side once we see our money flow unit prices targets come into play.
Although the bounce zone off 3500 (mob band) may produce a bit more rally, we are ultimately looking for a move that see the index fall below 3100.
S&P 500 Index “weekly” Chart
Twitter: @GuyCerundolo
The author or his firm have a position in mentioned securities at the time of publication. Any opinions expressed herein are solely those of the author, and do not in any way represent the views or opinions of any other person or entity.

: Worrisome to Broader Market?")

