Last week, we put out a short-term bearish note on the S&P 500 Index INDEXSP: .INX expecting a reversal lower (pullback).
Today, we provide an update on our analysis with potential price targets.
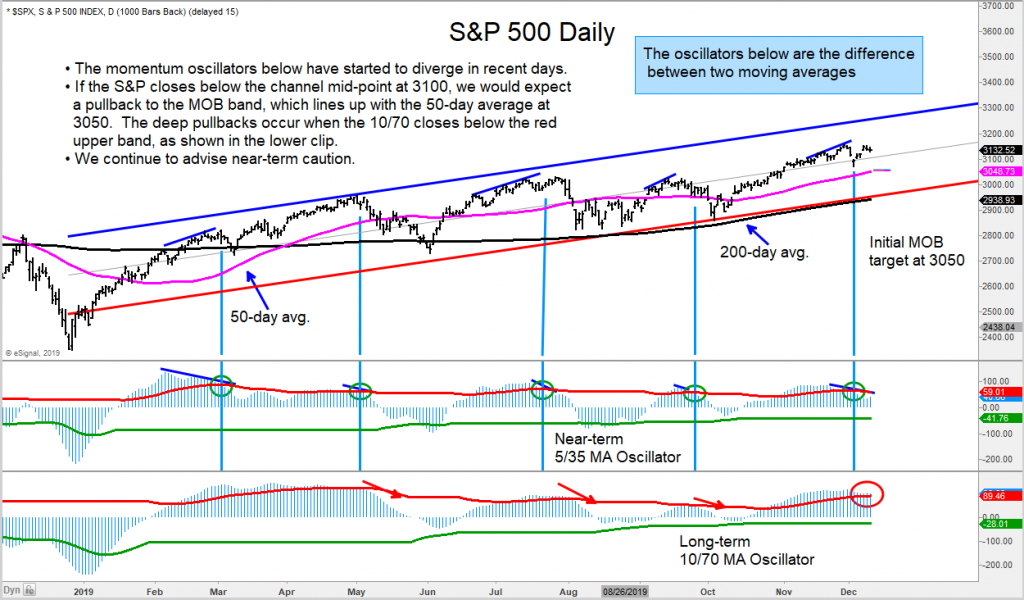
In the chart below, we can see that the momentum oscillators on the S&P 500 Index are diverging.
Should the S&P 500 close below its price channel mid-point at 3100, we would expect to see 3050 shortly thereafter.
3050 is where our MOB band is located, along with the 50 day moving average.
Deep pullbacks tend to occur when the 10-70 MA (moving average) oscillator closes below red upper band – see lower clip.
We continue to be near-term cautious.
S&P 500 Index “daily” Chart
The author may hold positions in mentioned securities at the time of publication. Any opinions expressed herein are solely those of the author, and do not in any way represent the views or opinions of any other person or entity.


