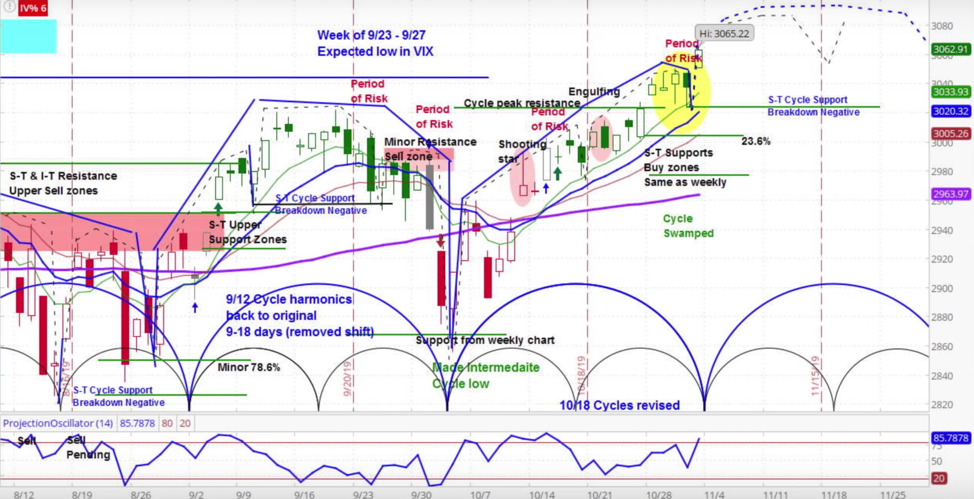
The stock market made good gains last week as investors danced to a drumbeat of better than expected earnings, as I pointed out in the latest Market Week show.
The S&P 500 Index INDEXSP: .INX rose 44 points to 3067, an increase of 1.5%.
With earnings season in full swing, companies in the S&P 500 continued to beat expectations, with 76% outperforming on earnings. Yet they continued the trend of revising guidance lower by a better than 2 to 1 ratio.
Also of note, economic data was mixed last week, with consumer confidence and manufacturing underperforming expectations while home sales, GDP, and job creation outperformed. Around the world manufacturing PMIs in China, UK, and the US were also mixed.
Our approach to technical analysis uses market cycles to project price action.
Our analysis is that the S&P 500 is now in the rising phase of its current cycle. We see higher prices, given that the bullish momentum from the previous cycle is still in effect. Our near-term target is 3090.
S&P 500 (SPX) Daily Chart

For the “Best and Worst Stocks of the Week” check out the askSlim Market Week show every Friday on our YouTube channel.
Twitter: @askslim
Any opinions expressed herein are solely those of the author, and do not in any way represent the views or opinions of any other person or entity.


