S&P 500 Futures Outlook for May 17 – True to form in the current environment (see yesterday’s opening paragraph), the buyers came to the rescues once more and gave the charts the added lift to rise off support levels. Range expansion continues, but sellers were aggressive at the regions near 2068 and forced the chart back into the opening tick.
How we manage the retest of 2054 and potential test of 2060 on S&P 500 futures will telegraph the future motion on the charts for the day.
If we are able to keep the 2062.75 price retest, buyers are more apt to the retrace upward back into resistance near 2065-2066, and 2071.5, before sellers try to force buyers back down again. Lots of overhead supply exists. Lots of chatter continues about the Fed raising the rates at the next meeting release. I suspect we chop through this region for the month ahead waiting on the Fed and the news on Brexit (the UK leaving the EU).
Momentum on the four-hour chart is now neutral. That means range bound behavior. Congestion of price makes directional breaks somewhat difficult. The very big picture remains bullish – with the key support action near 2027.
See today’s economic calendar with a rundown of releases.
THE RANGE OF TUESDAY’S MOTION
E-mini S&P 500 Futures (ES_F)
Below is a S&P 500 futures chart with price support and resistance trading levels for today. Click to enlarge.
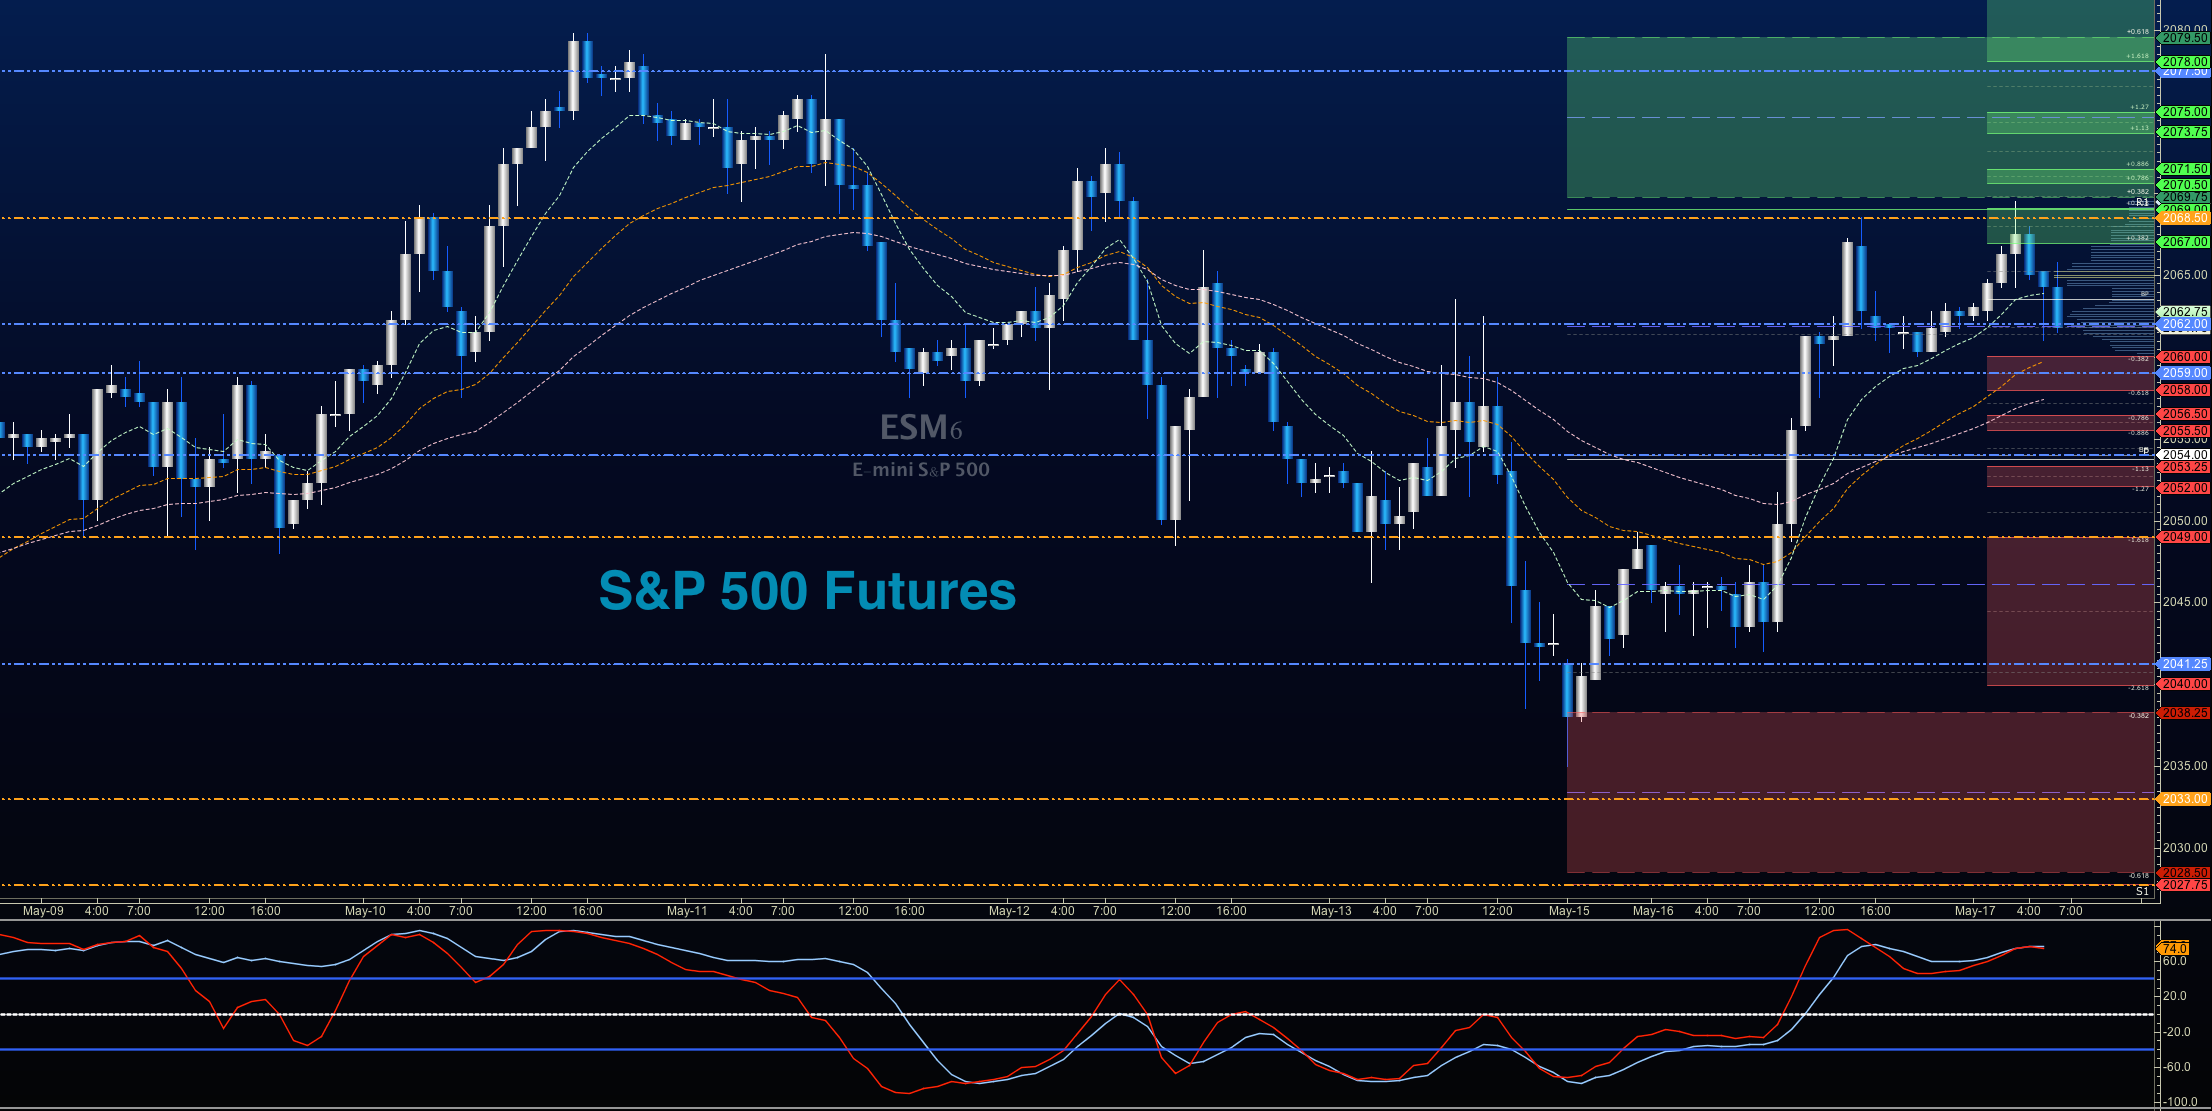
S&P 500 future outlook for May 17, 2016 – Trading appears to be quite range bound, but retesting the edges of intraday support at 2052. We are likely to try to hold support between 2052 and 2055.
Upside or long trades on S&P 5oo futures – The best setups sit on the positive retest of 2062.5, or a bounce off 2055.25 with positive momentum. I use the 30min to 1hr chart for the breach and retest mechanic. Targets from 2055.25 are 2057.25, 2060.5, 2063.25, 2066.5, 2068.5, 2071.25, and if we can catch a bid there, we could expand into 2073.5, 2076.25, and 2078.75.
Downside or short trades on S&P 500 futures – Favorable setups sit below the failed retest of 2060 or at the failed retest of 2067.25 with negative divergence. Retracement into lower levels from 2067.25 gives us the targets 2064.75, 2061.75, 2057.5, 2055.25, 2053, 2051.5, and perhaps 2046.75.
Have a look at the Fibonacci levels marked in the blog for more targets.
Crude Oil Futures (CL_F)
Outlook for crude oil for May 17, 2016 – Note that there is an API report after the close today. After suggesting that pullbacks would create buying opportunities yesterday intraday, I am now looking for range expansion to create selling events on the horizon. Oil has slammed into a key congestion region above with lots of overhead supply. Beyond this 48.45 region, there is a potential stretch into 49.6 and then 50, but that fails into the unlikely region for a test at this time. Even if it does test, it will not break out in this current formation, but will retrace into higher support before moving again.
The trading range for crude oil prices suggests support action near 47.4, and resistance behavior near 49.08.
Upside or long trades can be staged on the positive retest of 48.02, or a bounce off 47.4, but watch for resistance after the breach of 48.02, near 48.24, and 48.4. I often use the 30min to 1hr chart for the breach and retest mechanic. Targets from 47.4 are 47.68, 47.89, 48.02, 48.23, and if we can catch a bid there, we could expand into 48.4, 48.78 to 49.08. Upper targets loom near 49.55 and 50.04. Next week’s API report and EIA report may likely be affected by Nigeria disruption, and could provide the catalyst for the chart to expand into these final targets.
Downside trades for crude oil continue to setup well below failed retests – Today, I’m looking for the failed retest of 47.6, or at the failed retest of 47.94 with negative divergence – careful to watch for higher lows at the short on the resistance level. We remain in a very important congestion zone on larger time frames – a very important resistance area about $2 wide. Retracement into lower levels from 47.94 give us the targets 47.67, 47.46, 47.17, 47.04, 46.79, 46.49, 46.24, 46.04, and perhaps 45.96, 45.74, 45.56, 45.27, 45.04, though these deeper supports look quite unlikely today.
Have a look at the Fibonacci levels marked in the blog for more targets.
Visit TheTradingBook.com for more information.
If you’re interested in the live trading room, it is now primarily stock market futures content, though we do track heavily traded stocks and their likely daily trajectories as well – we begin at 9am with a morning report and likely chart movements along with trade setups for the day.
As long as the trader keeps himself aware of support and resistance levels, risk can be very adequately managed to play in either direction as bottom picking remains a behavior pattern that is developing with value buyers and speculative traders.
Twitter: @AnneMarieTrades
The author trades stock market futures every day and may have a position in mentioned securities at the time of publication. Any opinions expressed herein are solely those of the author, and do not in any way represent the views or opinions of any other person or entity.


: Showing Some Signs of Emerging Strength")
