Broad Stock Market Futures Trading Outlook for April 19, 2018
As traders took us higher yesterday, we paused and did not breach higher than early morning highs. Today, we are in a retrace of some of this action.
Pullbacks will continue to be buying zones but profit taking may take the dips a bit deeper for now. How bulls react at lower supports will be key.
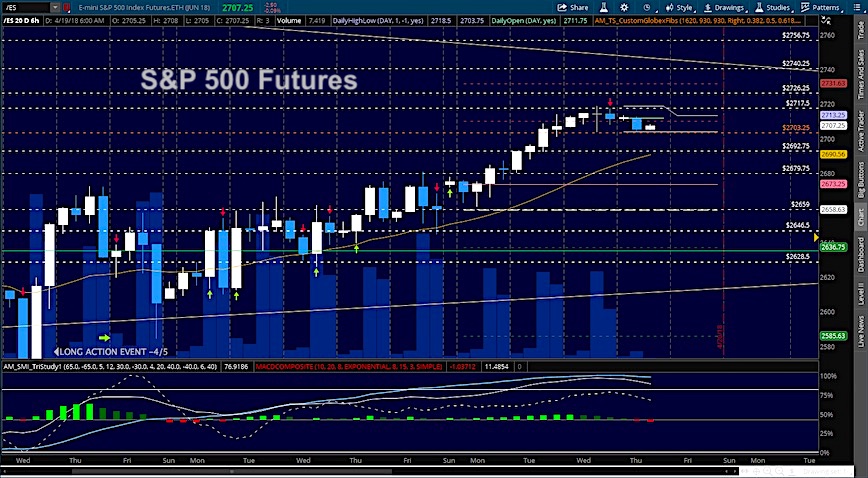
Stall at yesterday’s highs – Traders are still likely to take us to resistance near 2726 but we stalled at 2717 yesterday without a solid push forward. Reversals are still likely to be short-lived – particularly at the first pass fade into congestion. The bullets below represent the likely shift of trading momentum at the positive or failed retests at the levels noted.
- Buying pressure intraday will likely strengthen with a bullish retest of 2717.75
- Selling pressure intraday will likely strengthen with a bearish retest of 2703.50
- Resistance sits near 2717.25 to 2726.75, with 2734.25 and 2742.75 above that.
- Support sits between 2704.75 and 2692.5, with 2680.75 and 2668.50
NASDAQ Futures
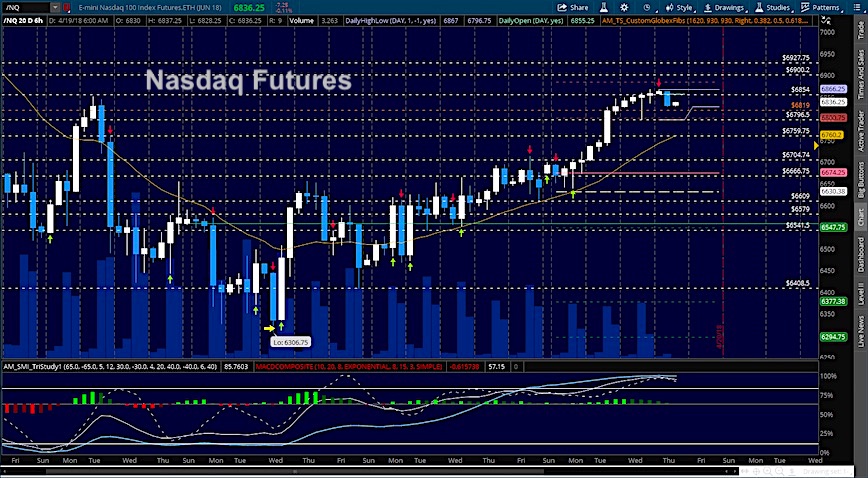
Charts for this instrument have shown the stall at higher resistance levels below a key area near 6884. Pullbacks into congestion and support will still be buying zones. Holding 6815 will be important to buyers for another day. The failure to breach resistance presents clues of reversal but these pullbacks will only be into higher support levels in the current formation. That may change but as the charts hold at this viewing, we see buyers poised to take advantage of lower prices. The bullets below represent the likely shift of intraday trading momentum at the positive or failed tests at the levels noted.
- Buying pressure intraday will likely strengthen with a bullish retest of 6860.75
- Selling pressure intraday will likely strengthen with a bearish retest of 6812
- Resistance sits near 6852.5 to 6879.75 with 6900.5 and 6936.25 above that.
- Support sits between 6815 and 6803, with 6778.75 and 6735.75 below that.
WTI Crude Oil
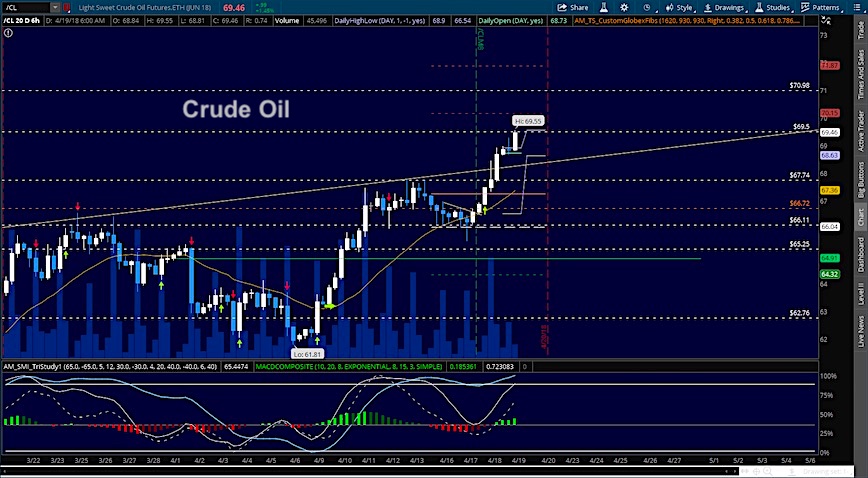
Bullish action prevails as we hold buying pressure into multi-year highs in oil. Yesterday’s low will provide support if traders are intent on holding higher formations. The failure to make new highs is the first test of a reversing formation – STILL not currently visible, so shorting here before this appears is essentially a fool’s errand. The bullets below represent the likely shift of intraday trading momentum at the positive or failed tests at the levels noted.
- Buying pressure intraday will likely strengthen with a bullish retest of 69.54
- Selling pressure intraday will strengthen with a bearish retest of 68.60
- Resistance sits near 69.46 to 69.78, with 70.15 and 70.86 above that.
- Support holds near 68.63 to 68.2, with 67.74 and 66.78 below that.
Twitter: @AnneMarieTrades
The author trades stock market futures every day and may have a position in mentioned securities at the time of publication. Any opinions expressed herein are solely those of the author, and do not in any way represent the views or opinions of any other person or entity.


")


