S&P 500 Futures Trading Chart – August 28
Our key index that we follow is the S&P 500 Index INDEXSP: .INX – primarily futures. Currently, index futures are trying to hold above deep support.
MARKET COMMENTARY
Market participants continue to hold steady near support but remain tentative with momentum damp and lackluster participation.
Currency news, dividend yielding stocks, bond yields falling and more about the inverted curve permeates the airwaves. The long weekend is ahead with many checking out after Thursday – volume remains very light as participants get tired of whipsaw.
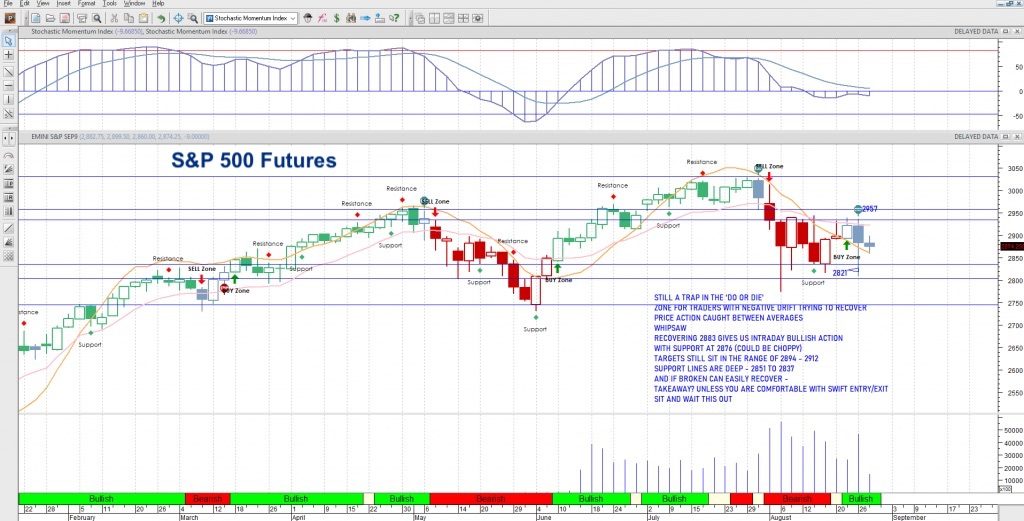
THE PRICE ACTION
Rangebound and holding new support just below 2870- a bit of a water mark for buyers today. Ranges are still wide with the fat line in the sand for resistance as the region between 2907-2931 for upside pressure but just below that we see the range of 2874 to 2897- this is where we are currently battling and where I suspect most sellers sit. To be sure, sellers are in control as the memories of sharp December selloffs and deep market dips leave traders skittish and hesitant to stay long.
COMMODITY & CURRENCY WATCH
Gold holds positive trend but still with pesky divergence beneath with silver exploding higher in a late move to the ‘precious’ metals party. Support levels in gold are near 1530 for now.
Currency risks remain in play. The USD index now holds near 98. Steep fades create buying opportunities here. WTI is still solidly range bound where buyers are more comfortable at deep support near 53-54 and sellers at higher levels above 56.8- 57. We are battling on the upper edge of this range as news of Aramco selling WTI hits the wires.
INTRADAY MARKET VIEW
There’s a battle going on at price support. Technical damage from Friday’s break makes upside tenuous and today, we will likely hold levels between 2846 and 2896. All the indices are in a wide range with diminished momentum. Continue to be careful here on the edges of your charts as we could accelerate out and continue if traders get too heavy on the edges (case in point, Friday), after which, you’ll have to reverse your position. For now, edges remain reversal regions.
OVERALL WIDE ANGLE MARKET VIEW
Deep support bounces engage –shifting the balance of the traders into a scramble to maintain support. Sellers have the edge for now after the Friday move. Weekly charts continue to show flattening momentum and some more downside weakness that that is confirming but still close to major supports. Buyers are still showing up at deep value areas.
Twitter: @AnneMarieTrades
The author trades stock market futures every day and may have a position in mentioned securities at the time of publication. Any opinions expressed herein are solely those of the author, and do not in any way represent the views or opinions of any other person or entity.

 and Semiconductors (SMH): Concerning Price Pattern?")

 and Semiconductors (SMH): Concerning Price Pattern?")


