Broad Stock Market Futures Outlook for June 15, 2018
Sellers have come in and are testing the bulls resolve. Friday has been slightly bullish historically but considering where we are at, bounce are likely to fail.
The main level for bulls is 2785 – above that and the rally will continue. Below that and the bears are in short-term control.
Bullish undercurrents still prevail on longer time frames so expect deeper dips to find support.
S&P 500 Futures
Support near 2772 still holds -buyers struggle to advance price. We sit in similar formations from yesterday so our outlook is the same. The failure to recapture regions above 2785 will be a signal to sellers that they have a shot at the retests of support. If pressure keeps pushing on the support, it will break and head to known levels below. The bullets below represent the likely shift of trading momentum at the successful or failed retests at the levels noted.
- Buying pressure intraday will likely strengthen with a bullish retest of 2785.75
- Selling pressure intraday will likely strengthen with a bearish retest of 2772
- Resistance sits near 2788.5 to 2792.75, with 2797.5 and 2800.75 above that.
- Support sits between 2772 and 2765.75, with 2759.25 and 2746.75
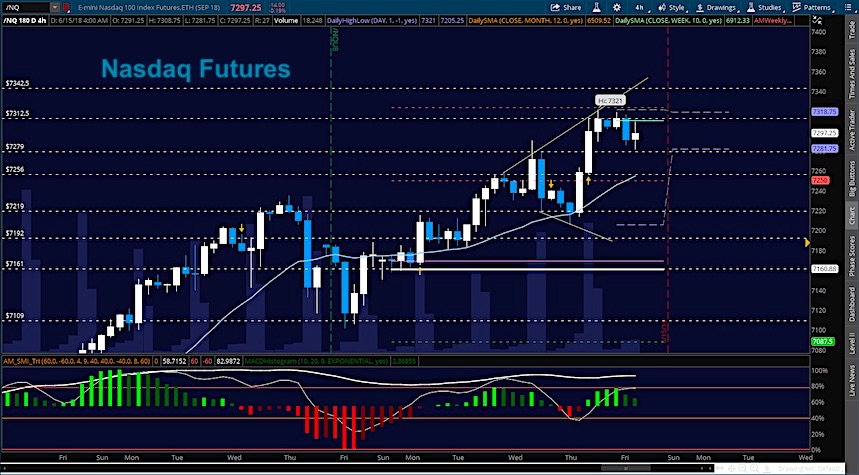
NASDAQ Futures
This chart continues to overshoot its targets creating thin volume pockets. Support holds higher as the chart continues to move upward. The line in the sand seems to be somewhere around 7280 at this time and below there, the volume is particularly thin. The bullets below represent the likely shift of trading momentum at the successful or failed retests at the levels noted.
- Buying pressure intraday will likely strengthen with a bullish retest of 7313.75
- Selling pressure intraday will likely strengthen with a bearish retest of 7279.5
- Resistance sits near 7324.5 to 7336.25 with 7349.5 and 7396.5 above that.
- Support sits between 7224.5 and 7205.5, with 7187.5 and 7157 .75 below that.
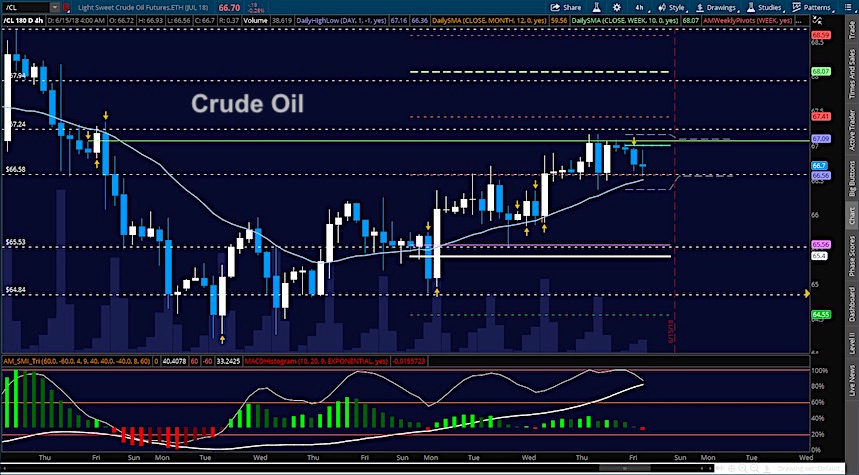
WTI Crude Oil
For the week of motion, oil remains bound above. Price action now drifts into old areas of resistance seen near 67.27 as the press toward the monthly opening tick looms nearby. Holding above this region opens more than 100 ticks of upside so I suspect many traders will be watching here. The bullets below represent the likely shift of trading momentum at the successful or failed retests at the levels noted.
- Buying pressure intraday will likely strengthen with a bullish retest of 67.27
- Selling pressure intraday will strengthen with a bearish retest of 66.5
- Resistance sits near 67.24 to 67.54, with 68.28 and 68.56 above that.
- Support holds near 66.56 to 66.12, with 65.76 and 65.49 below that.
Twitter: @AnneMarieTrades
The author trades stock market futures every day and may have a position in mentioned securities at the time of publication. Any opinions expressed herein are solely those of the author, and do not in any way represent the views or opinions of any other person or entity.


