Broad Stock Market Futures Outlook for July 17, 2018
Recent weakness on the S&P 500 (INDEXCBOE:.INX) will likely see tests of short-term trading support(s).
I am watching support on the Nasdaq Composite (INDEXNASDAQ:.IXIC) for signs that buyers are holding or giving way. The Other indices are showing signs of a topping formation traders must stay very focused and be ready to trade both side this week.
S&P 500 Futures
Tests of resistance and higher lows hold across the board on larger time frames for yet another day.
We are a bit toppy and could have a bit of contagion with a dip downward from the Nasdaq futures Deep dips will continue to be buying zones. The bullets below represent the likely shift of trading momentum at the successful or failed retests at the levels noted.
- Buying pressure intraday will likely strengthen with a bullish retest of 2807.75
- Selling pressure intraday will likely strengthen with a bearish retest of 2791.75
- Resistance sits near 2801.75 to 2807.5, with 2813.75 and 2824.75 above that.
- Support sits between 2792.25 and 2787.5, with 2784.75 and 2778.75
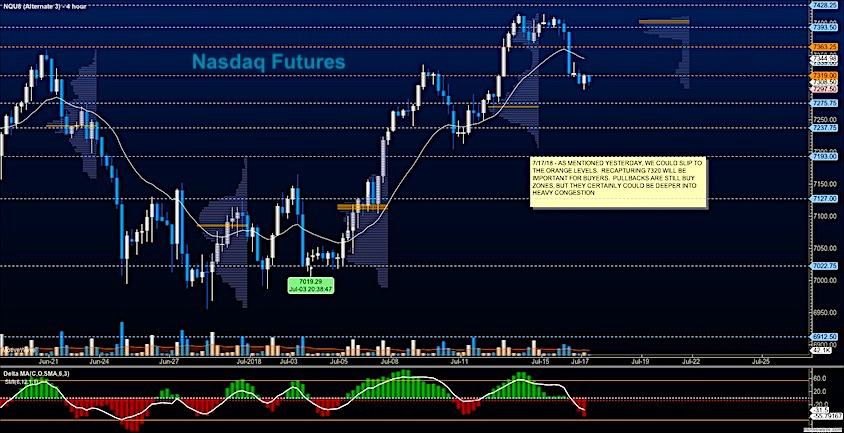
NASDAQ Futures
Netflix dealt a mighty blow to this chart overnight. We now sit in a solid support zone that has brought buyers into the fray. Pullbacks remain buying spaces for traders into the earnings but a fade like this needs to quickly recapture support else resistance will take hold and we will head into deeper congestion. The bullets below represent the likely shift of trading momentum at the successful or failed retests at the levels noted.
- Buying pressure intraday will likely strengthen with a bullish retest of 7331.75
- Selling pressure intraday will likely strengthen with a bearish retest of 7240.5
- Resistance sits near 7338.5 to 7368.5 with 7375.5 and 7404.25 above that.
- Support sits between 7277.5 and 7234.5, with 7217.5 and 7168.75 below that.
WTI Crude Oil
For the third day, traders continue to sell off the WTI in profit-taking moves, but we are finally holding 67.9. Buyers are likely to try a shot at buying near 67.9 with the API and the EIA ahead in the coming days. The bullets below represent the likely shift of trading momentum at the successful or failed retests at the levels noted.
- Buying pressure intraday will likely strengthen with a bullish retest of 68.58
- Selling pressure intraday will strengthen with a bearish retest of 67.62
- Resistance sits near 68.86 to 69.14, with 69.7 and 70.75 above that.
- Support holds near 68.08 to 67.67, with 67.24 and 66.59 below that.
CHART
Twitter: @AnneMarieTrades
The author trades stock market futures every day and may have a position in mentioned securities at the time of publication. Any opinions expressed herein are solely those of the author, and do not in any way represent the views or opinions of any other person or entity.


