Broad Stock Market Futures Outlook for April 26, 2018
As expected, we got the oversold bounce we were looking for. This morning we sit near price resistance once more as price action tightens within a wedge formation.
Crosscurrents are heavy and traders don’t appear ready to “commit” to their decisions just yet (meaning lots of quick trades in and out but no one willing to commit to the continuation of a move). Use caution with position size and exercise patience!
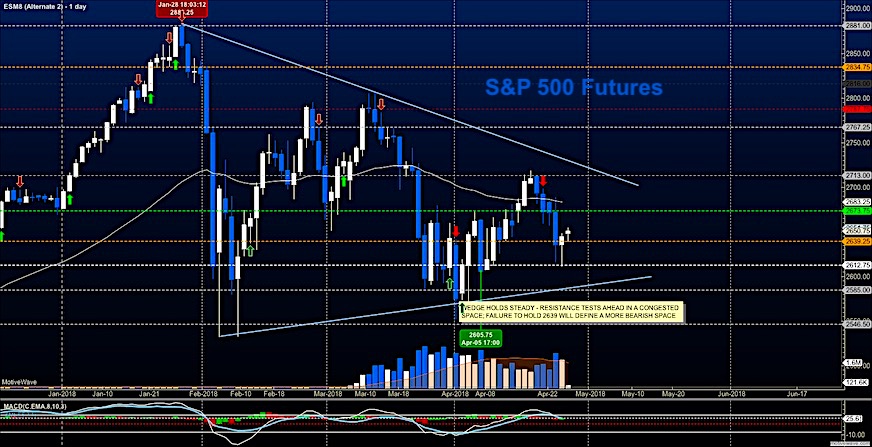
S&P 500 Futures
Bounces are holding into the early morning here as we attempt to test 2660-2664. Below this level, we are susceptible to more selling. Sellers are likely to be more aggressive below 2634. Expect candles to have significant wicks due to cross current action. The bullets below represent the likely shift of trading momentum at the positive or failed retests at the levels noted.
- Buying pressure intraday will likely strengthen with a bullish retest of 2664.75
- Selling pressure intraday will likely strengthen with a bearish retest of 2634.50
- Resistance sits near 2657.25 to 2664.75, with 2675.25 and 2683.75 above that.
- Support sits between 2639.5 and 2626.5, with 2606.5 and 2585.50
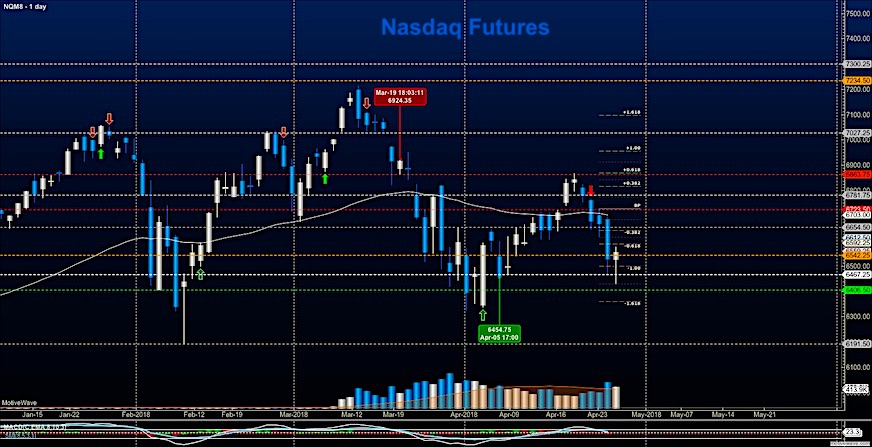
NASDAQ Futures
The wedge formation is also present here with resistance just ahead. The bounce is still in play and momentum is mixed, suggesting candles with wicks – so watch your edges form and be careful there in case it is spelling reversal in the short term….heavy congestion. Cautious trading into resistance as the press upward should fade into support at the first attempts. The bullets below represent the likely shift of intraday trading momentum at the positive or failed tests at the levels noted.
- Buying pressure intraday will likely strengthen with a bullish retest of 6621.75
- Selling pressure intraday will likely strengthen with a bearish retest of 6554
- Resistance sits near 6597.5 to 6620.25 with 6662.25 and 6734.25 above that.
- Support sits between 6557.5 and 6506.5, with 6434.5 and 6407.75 below that.
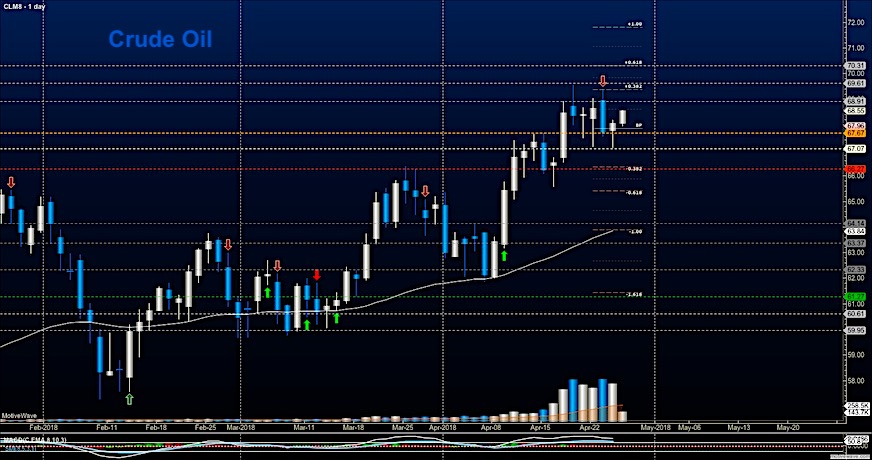
WTI Crude Oil
Bullish action prevails after a test of the critical zone near 67.7. Buyers are pushing us up into near-term resistance around 69, and a breach there will likely bring us a press to 70. Hedge funds remain leveraged close to 14:1 in long contracts to short ones so the chance of a fade is still present. The bullets below represent the likely shift of intraday trading momentum at the positive or failed tests at the levels noted.
- Buying pressure intraday will likely strengthen with a bullish retest of 69.06
- Selling pressure intraday will strengthen with a bearish retest of 68.03
- Resistance sits near 68.9 to 69.5, with 69.87 and 70.22 above that.
- Support holds near 67.85 to 67.26, with 66.78 and 66.37 below that.
Twitter: @AnneMarieTrades
The author trades stock market futures every day and may have a position in mentioned securities at the time of publication. Any opinions expressed herein are solely those of the author, and do not in any way represent the views or opinions of any other person or entity.


 Trading Into Inflection Point")

