Stock Market Trading Considerations For October 9, 2017
The S&P 500 (INDEXSP:.INX) is drifting higher this morning as traders enter the new week. The Nasdaq (INDEXNASDAQ:.IXIC) and tech stocks also remain strong. Below are several key futures trading levels for the S&P 500, Nasdaq, and Crude Oil.
Check out today’s economic calendar with a full rundown of releases. And note that the charts below are from our premium service and shared exclusively with See It Market readers.
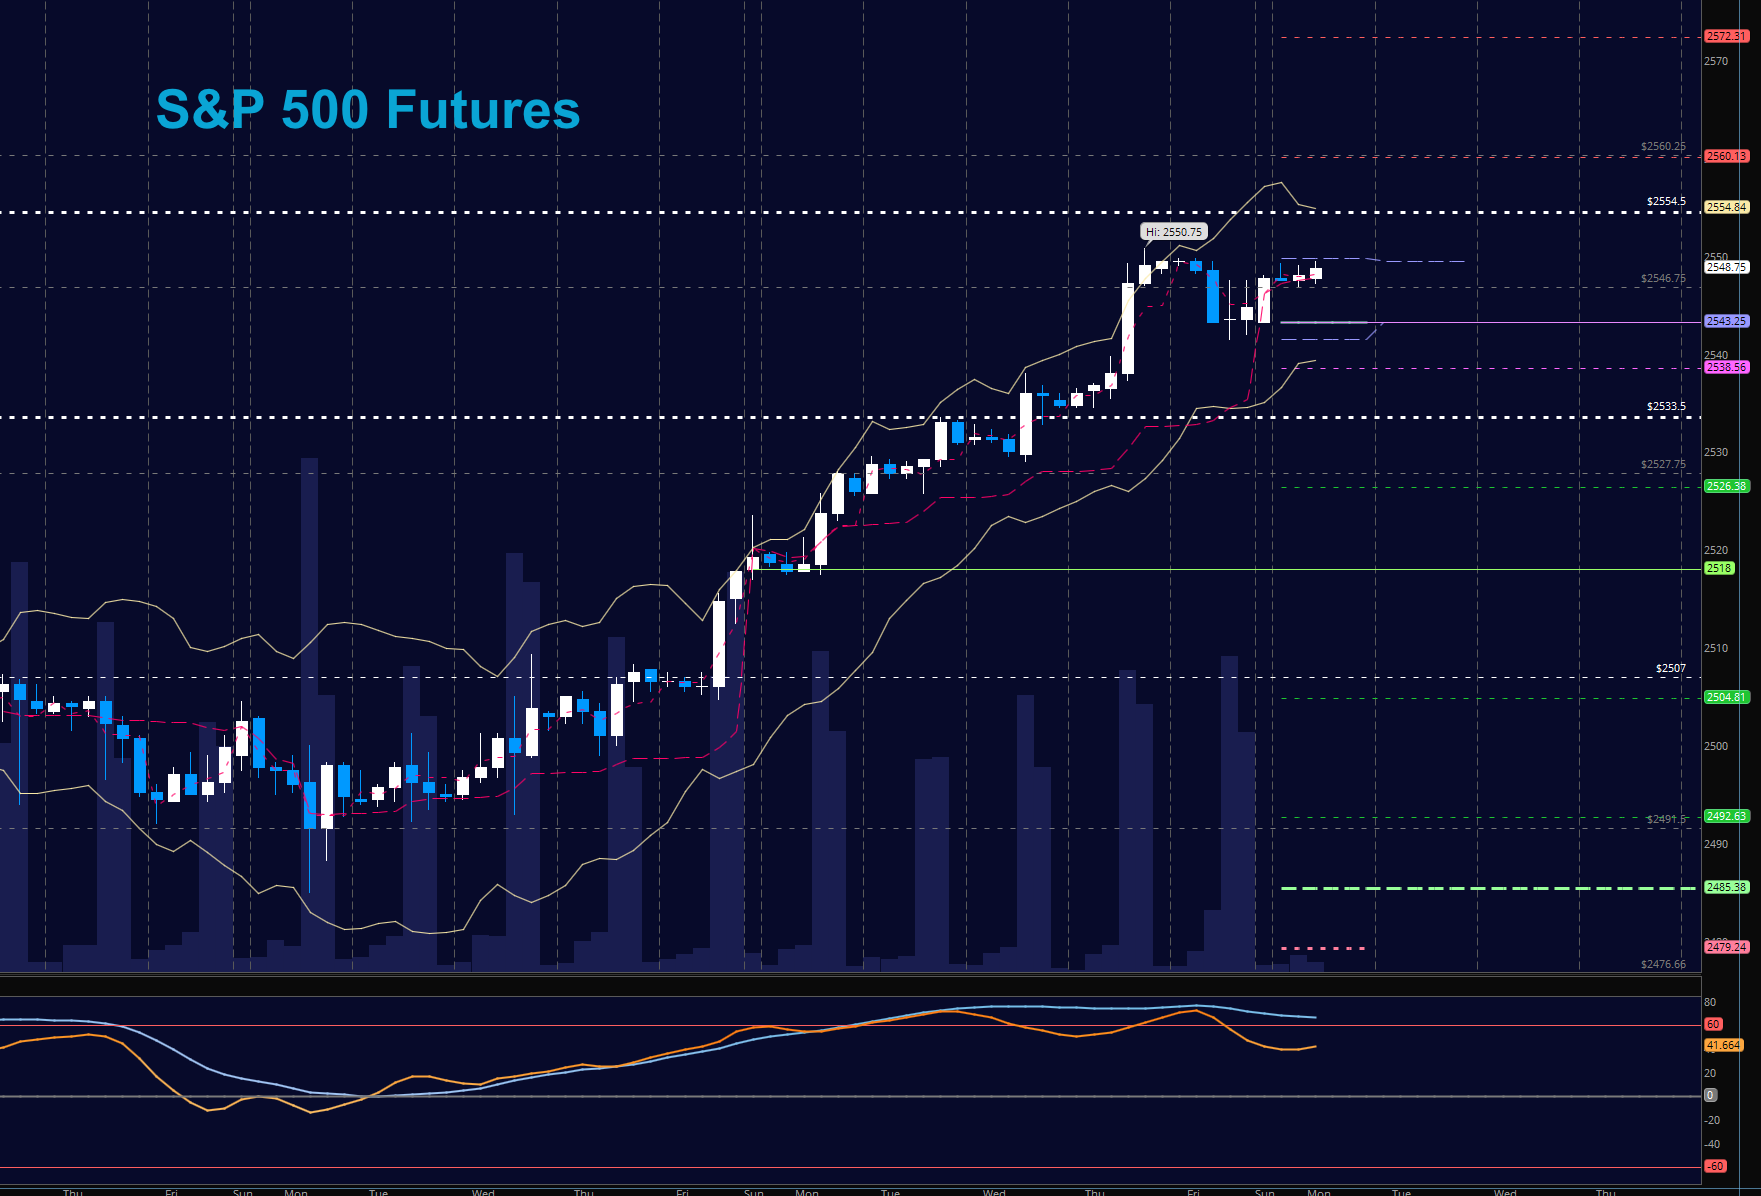
S&P 500 Futures (ES)
Charts hold higher lows with support holding at 2539.5 with 2541.5 just above. Formations are bullish but even in the face of divergence, charts hold steady with a slew of earnings this week on the horizon. The bullets below represent the likely shift of trading momentum at the positive or failed retests at the levels noted.
- Buying pressure intraday will likely strengthen above a positive retest of 2541
- Selling pressure intraday will likely strengthen with a failed retest of 2537
- Resistance sits near 2550.75 to 2554.5, with 2560.5 and 2562.25 above that.
- Support holds between 2541 and 2539.5, with 2533.75 and 2527.75 below that.
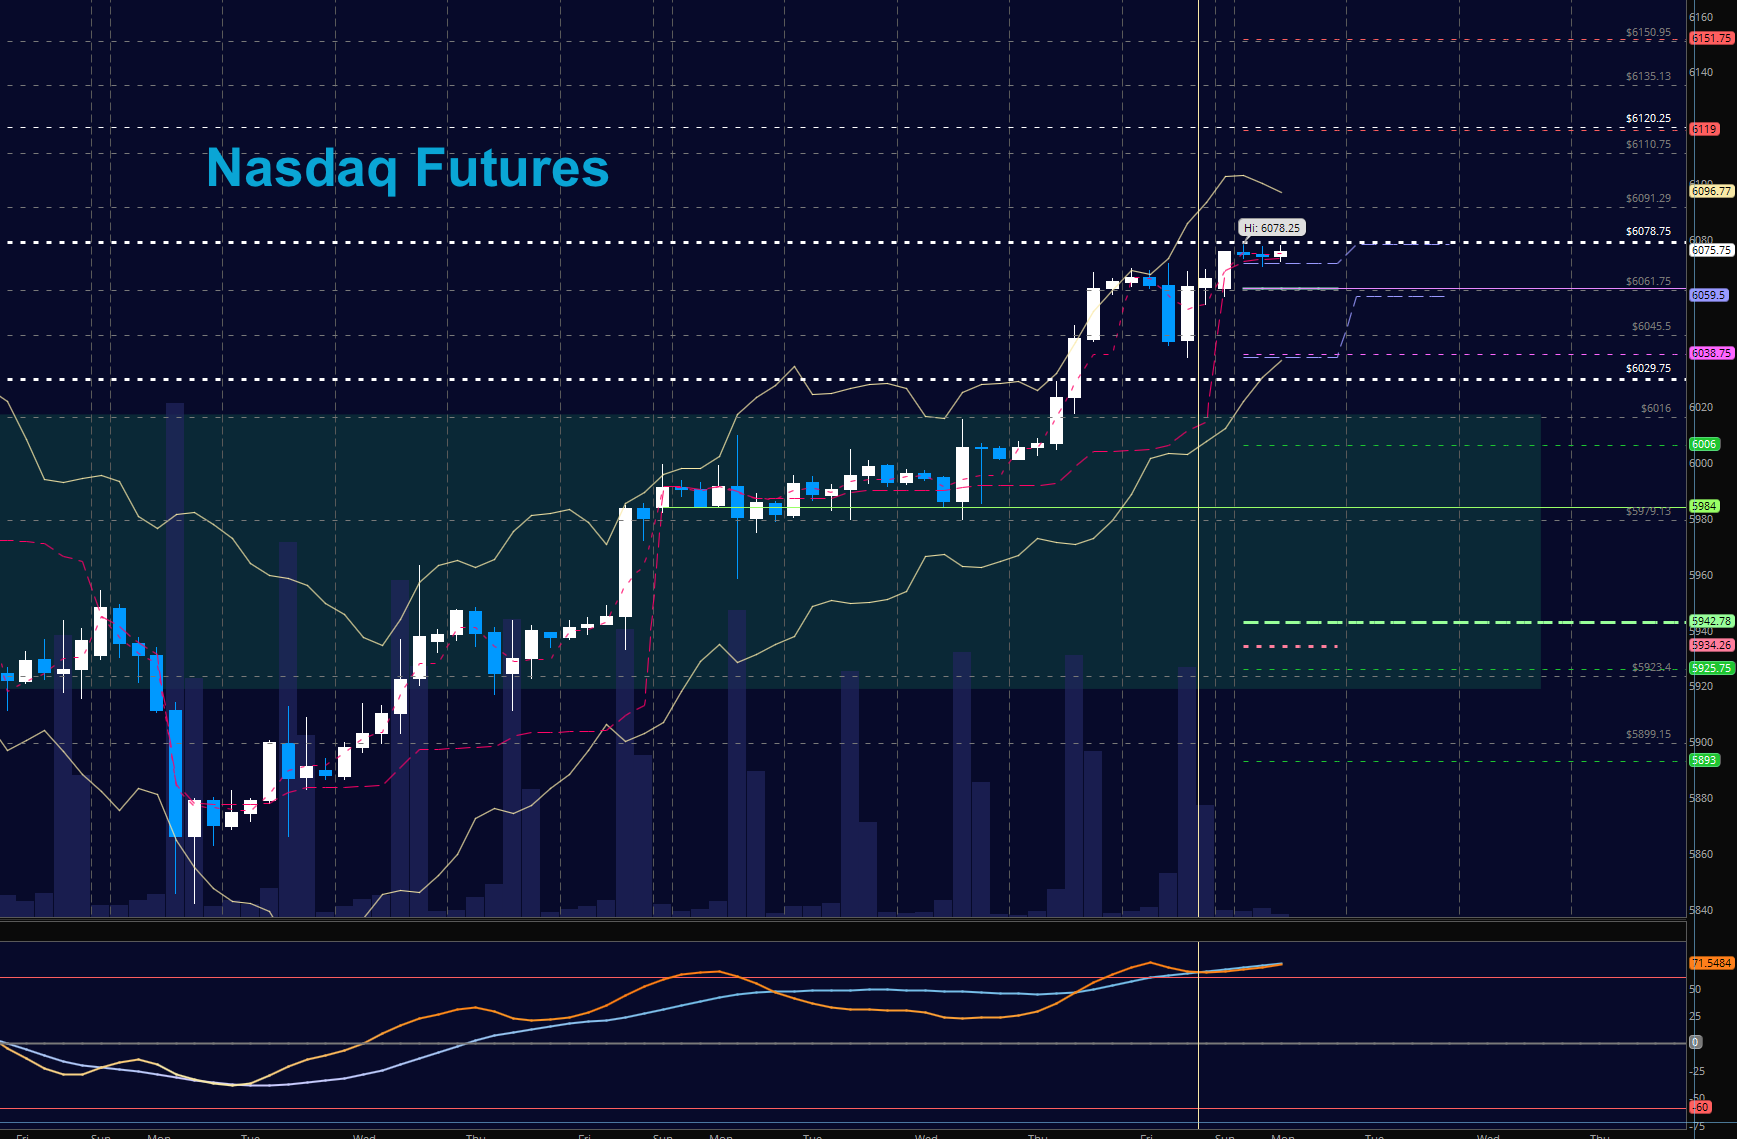
NASDAQ Futures (NQ)
Momentum still shows as bullish as traders test new highs in the premarket. Holding higher lows means we still have buyers in charge. Buyers need to hold 6029 for continuation forward. The bullets below represent the likely shift of intraday trading momentum at the positive or failed tests at the levels noted.
- Buying pressure intraday will likely strengthen with a positive retest of 6080
- Selling pressure intraday will likely strengthen with a failed retest of 6020.5
- Resistance sits near 6078.75 to 6091.5, with 6099.5 and 6110.75 above that.
- Support holds between 6037.5 and 6029.75, with 6020.5 and 6006.75 below that.
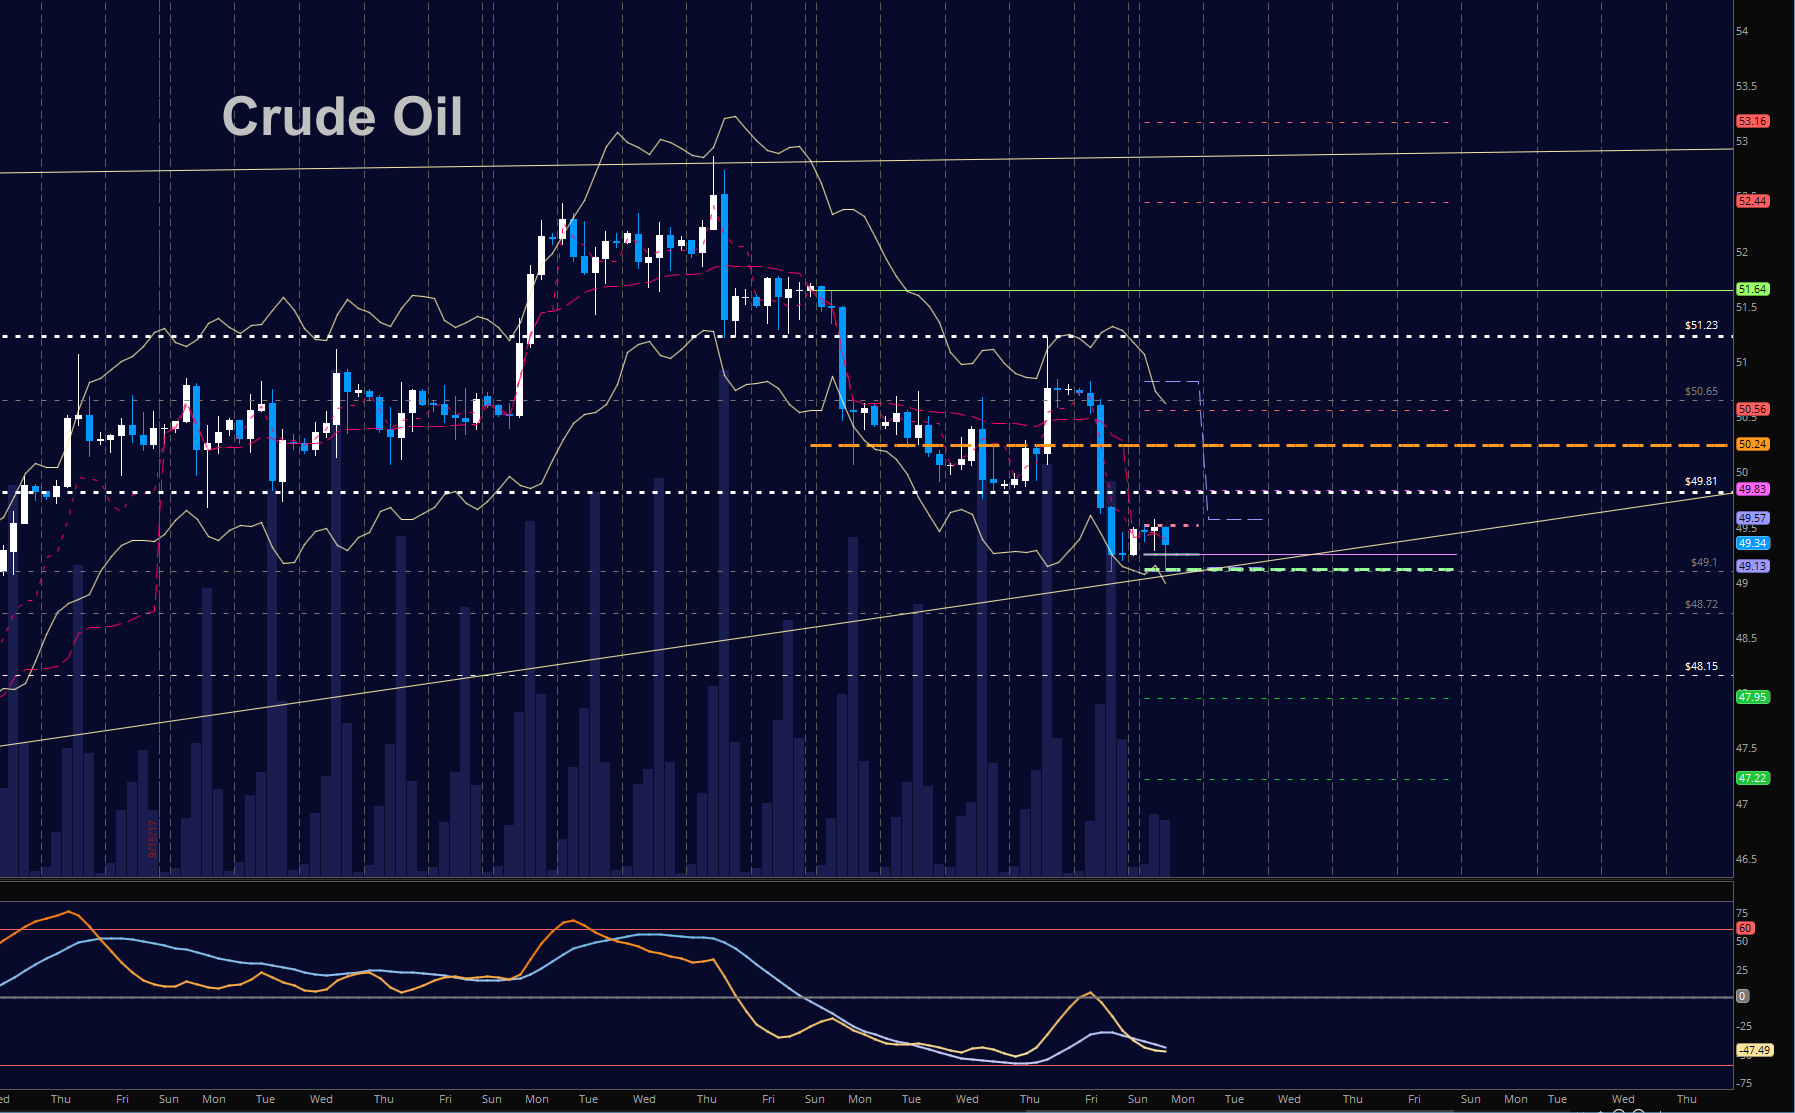
WTI Crude Oil
Crude seems to be attempting a short term bottoming formation holding 49.1. However, sellers are in charge below 50.04, so buyers here are likely very cautious into the hold of this level, knowing that the fade below will likely press us deep into 48 territory. The bullets below represent the likely shift of trading momentum at the positive or failed tests at the levels noted.
- Buying pressure intraday will likely strengthen with a positive retest of 50.24
- Selling pressure intraday will strengthen with a failed retest of 49.7
- Resistance sits near 49.52 to 49.84, with 50.24 and 50.88 above that.
- Support holds between 49.1 to 48.8, with 48.4 and 48.12 below that.
If you’re interested in the live trading room, it is now primarily stock market futures content, though we do track heavily traded stocks and their likely daily trajectories as well – we begin at 9am with a morning report and likely chart movements along with trade setups for the day.
As long as the trader keeps himself aware of support and resistance levels, risk can be very adequately managed to play in either direction as bottom picking remains a behavior pattern that is developing with value buyers and speculative traders.
Twitter: @AnneMarieTrades
The author trades stock market futures every day and may have a position in mentioned securities at the time of publication. Any opinions expressed herein are solely those of the author, and do not in any way represent the views or opinions of any other person or entity.


