Stock Market Considerations For October 6, 2017
The S&P 500 (INDEXSP:.INX) is digesting yesterday’s rally (and the rally of the past several days). Important trading price support and resistance pivots are listed below.
Check out today’s economic calendar with a full rundown of releases. And note that the charts below are from our premium service and shared exclusively with See It Market readers.
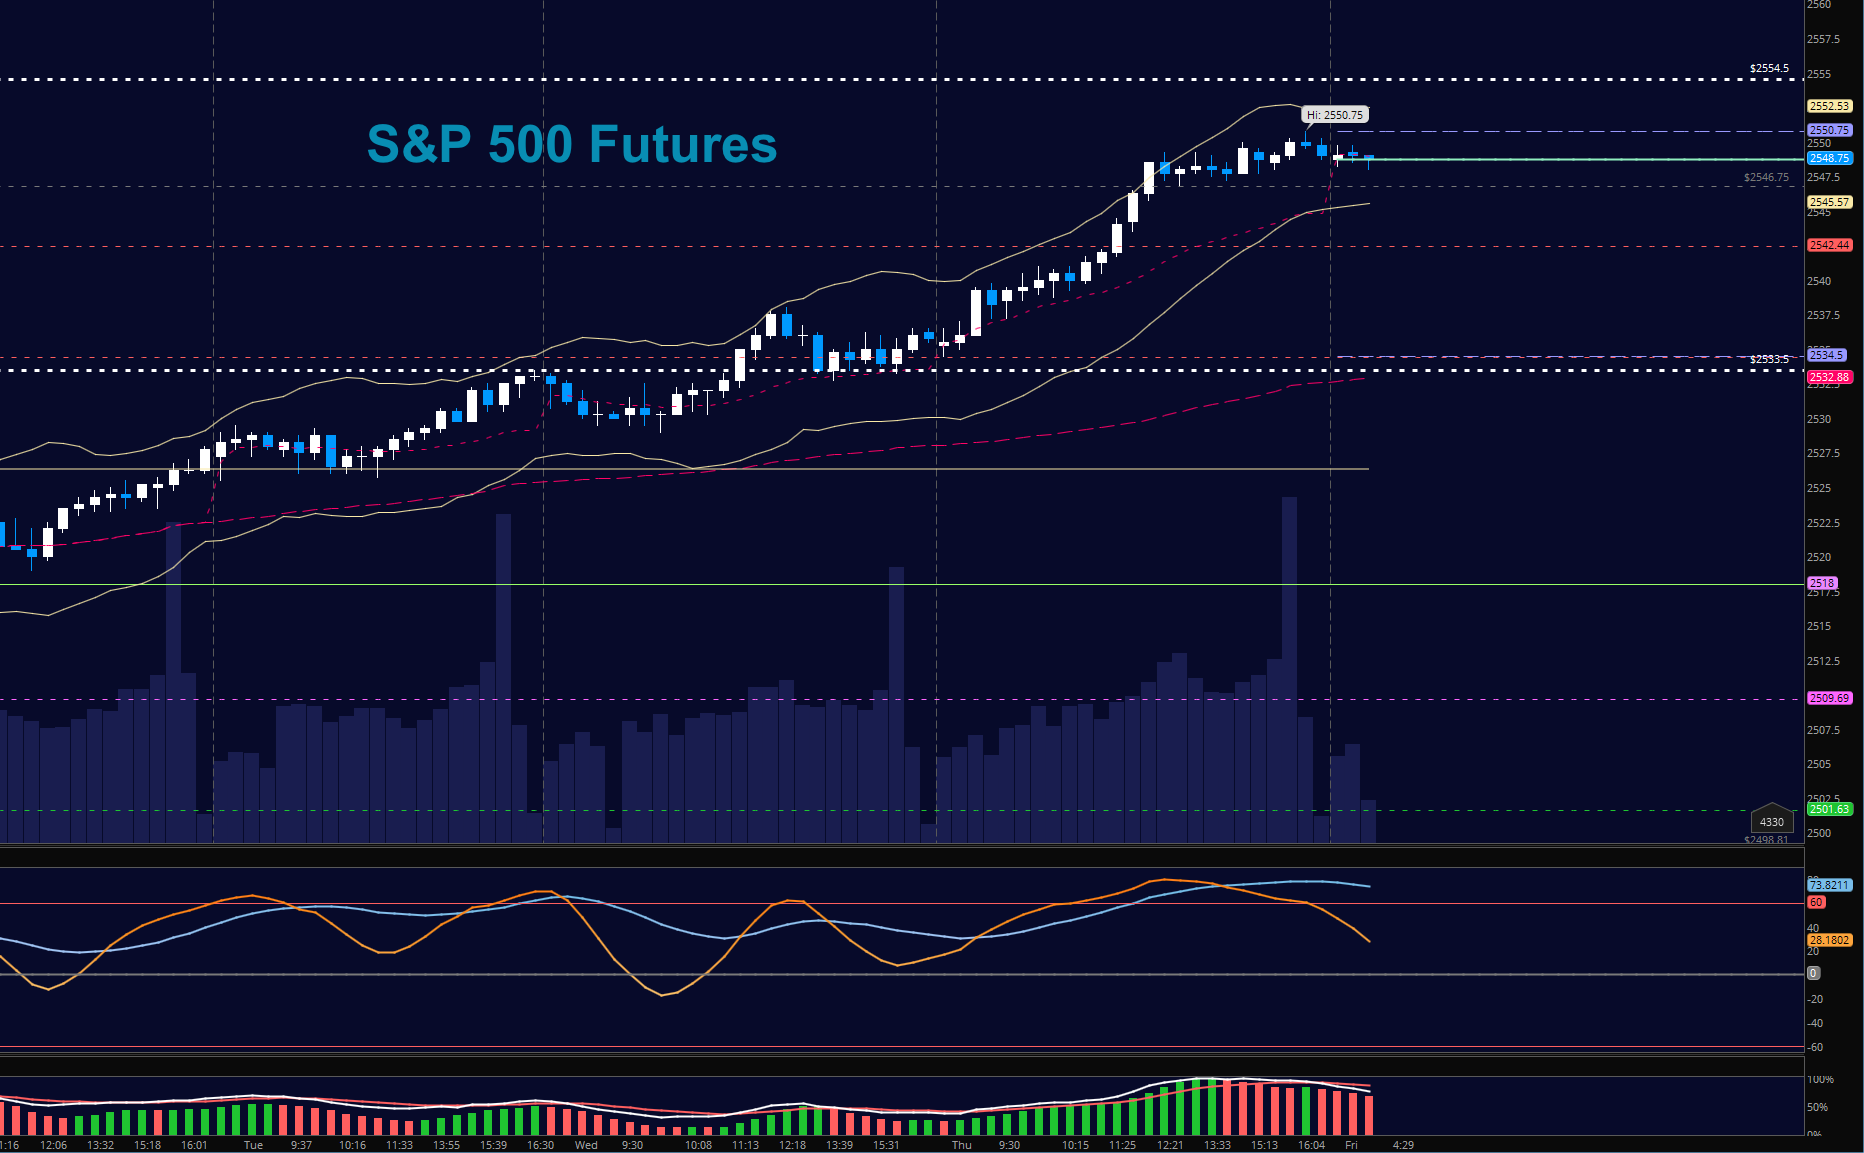
S&P 500 Futures (ES)
Non-farm payroll will get the action going again today but some digestion is likely. Charts have moved to new highs yesterday in front of this number which is expected to be quite positive. New support is higher yet again at 2539.5 with 2546 just above. Formations are bullish but divergent once again. There is the question of whether we are in a ‘buy the rumor, sell the news’ event. The bullets below represent the likely shift of trading momentum at the positive or failed retests at the levels noted.
- Buying pressure intraday will likely strengthen above a positive retest of 2542
- Selling pressure intraday will likely strengthen with a failed retest of 2534
- Resistance sits near 2548.75 to 2550.75, with 2552.5 and 2555 above that.
- Support holds between 2539 and 2534.5, with 2531.25 and 2525.75 below that.
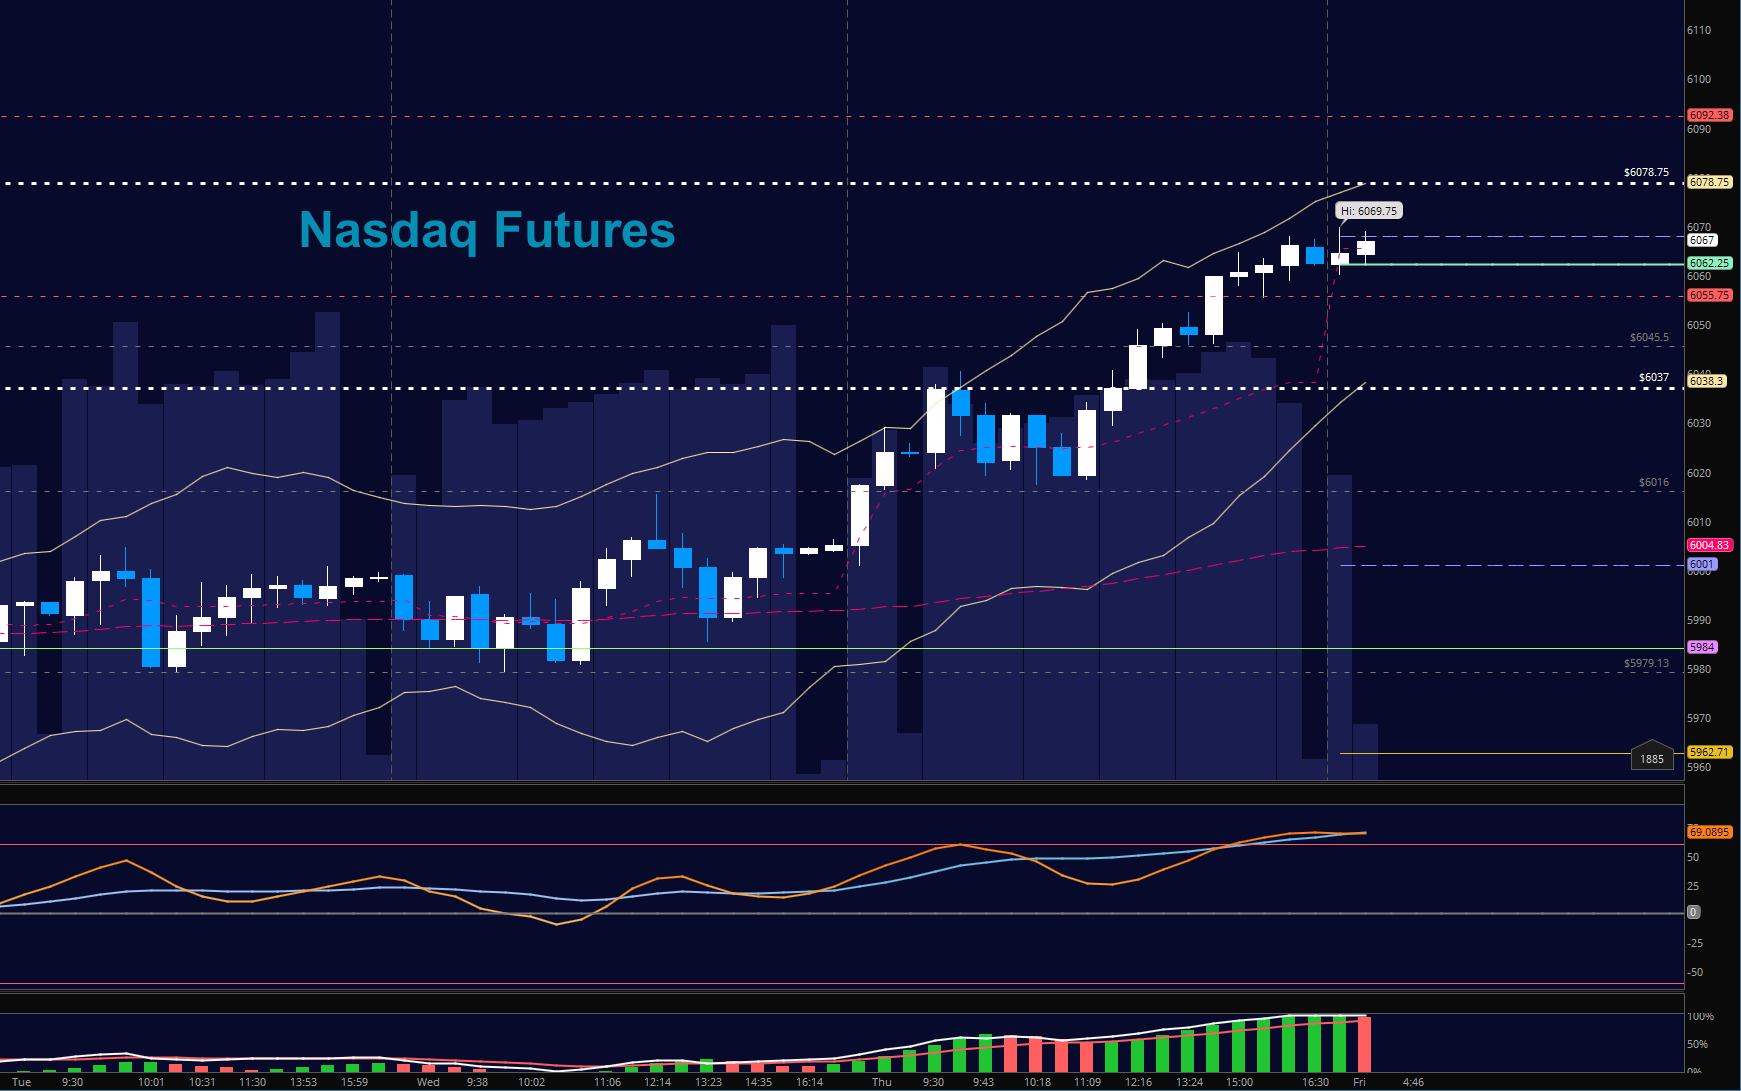
NASDAQ Futures
Momentum still shows as bullish as traders test new highs and weekly pivots noted earlier in the week. Holding higher lows means we still have buyers in charge. Buyers need to hold 6055 for continuation forward as they have for the last three days. The bullets below represent the likely shift of intraday trading momentum at the positive or failed tests at the levels noted.
- Buying pressure intraday will likely strengthen with a positive retest of 5999 (but only into resistance)
- Selling pressure intraday will likely strengthen with a failed retest of 5978
- Resistance sits near 6069.75 to 6078.5, with 6092.5 and 6110.5 above that.
- Support holds between 6054.5 and 6033, with 6020.75 and 6014.75 below that.
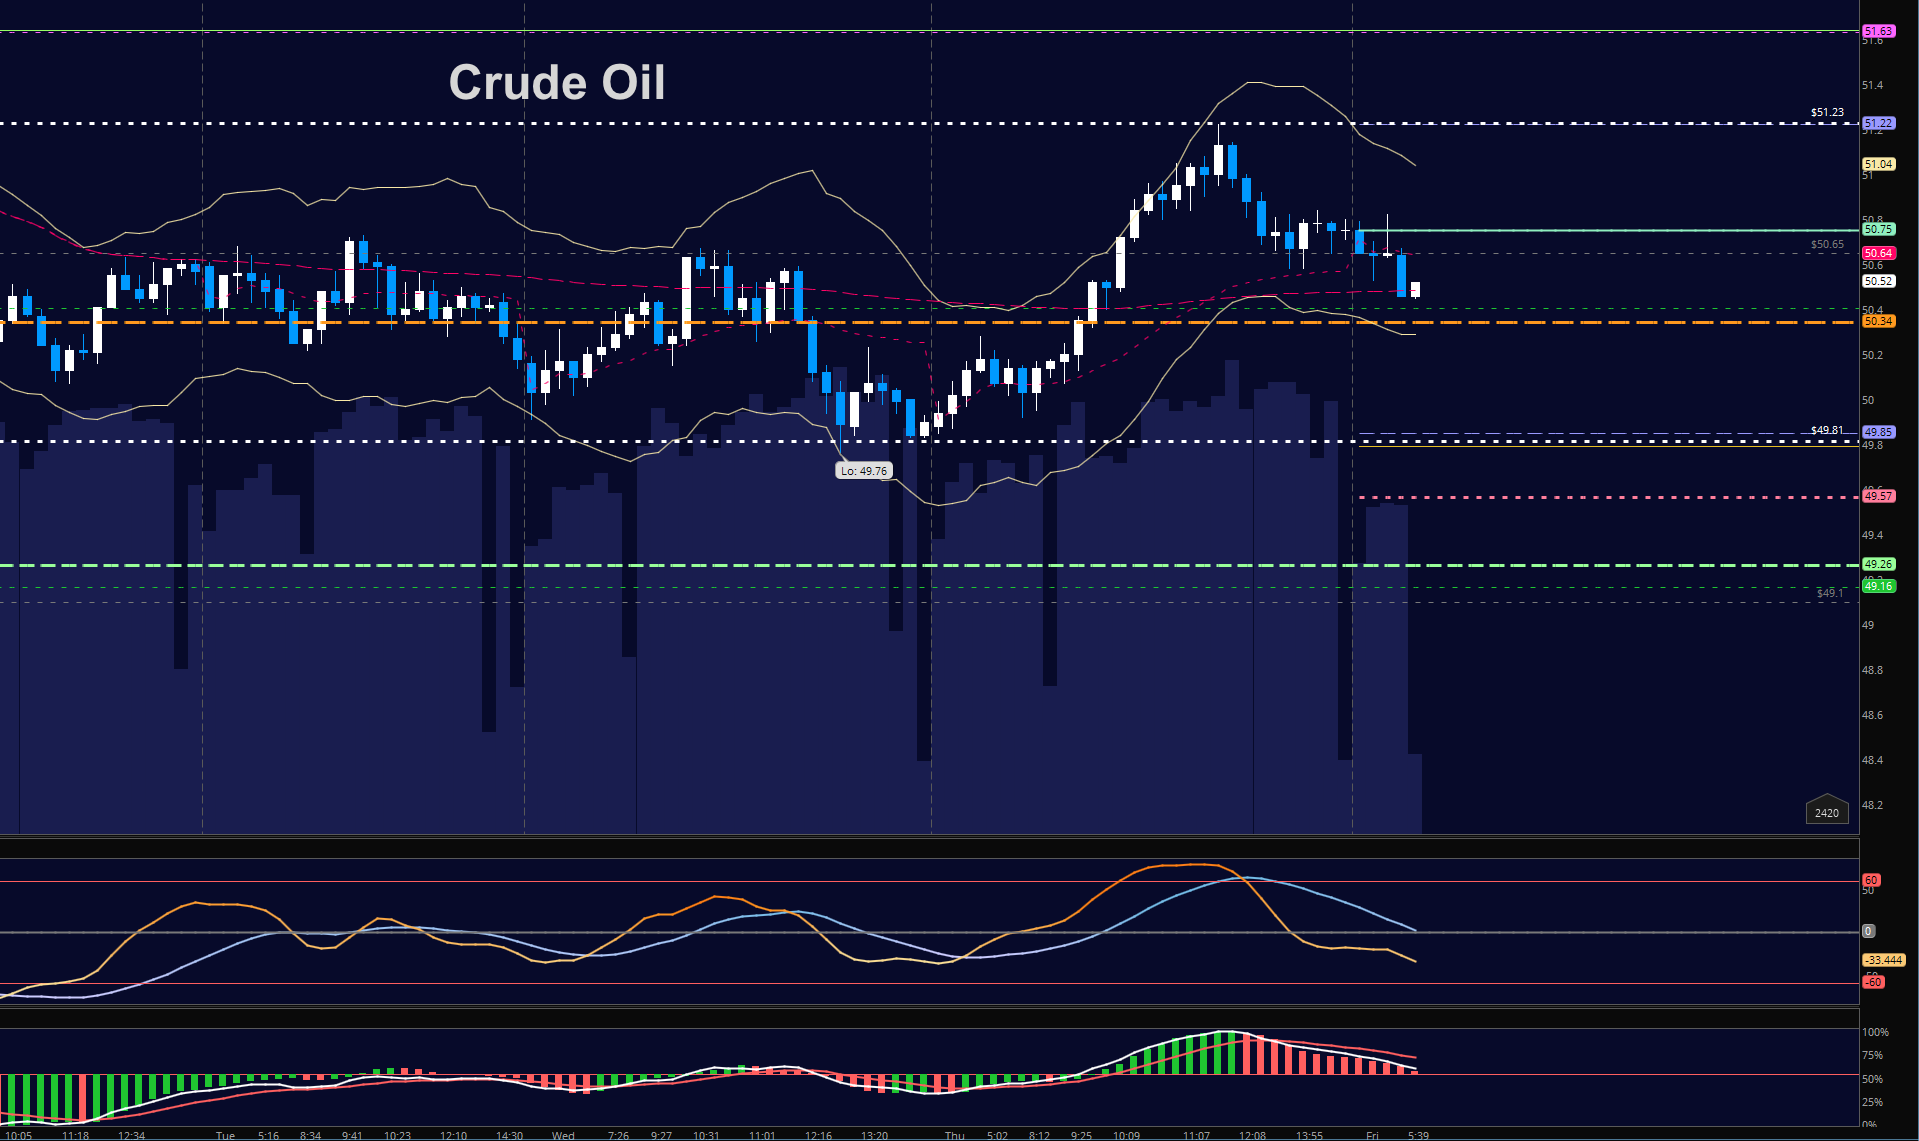
WTI Crude Oil
Bounce yesterday fades off resistance level near 51.14 but buyers are still holding us above 50. Sellers are in charge below 50.04. The bullets below represent the likely shift of trading momentum at the positive or failed tests at the levels noted.
- Buying pressure intraday will likely strengthen with a positive retest of 50.78
- Selling pressure intraday will strengthen with a failed retest of 49.78
- Resistance sits near 50.68 to 51.04, with 51.24 and 51.68 above that.
- Support holds between 50.02 to 49.8, with 49.4 and 49.16 below that.
If you’re interested in the live trading room, it is now primarily stock market futures content, though we do track heavily traded stocks and their likely daily trajectories as well – we begin at 9am with a morning report and likely chart movements along with trade setups for the day.
As long as the trader keeps himself aware of support and resistance levels, risk can be very adequately managed to play in either direction as bottom picking remains a behavior pattern that is developing with value buyers and speculative traders.
Twitter: @AnneMarieTrades
The author trades stock market futures every day and may have a position in mentioned securities at the time of publication. Any opinions expressed herein are solely those of the author, and do not in any way represent the views or opinions of any other person or entity.


