Stock Market Outlook for October 3, 2016 –
Last week’s candle stick on the S&P 500 chart gave us a very tight open to close. And it was well inside of the range of the week before. This leaves the S&P 500 (INDEXSP:.INX) in a clearly undecided space, and still quite range bound. Over the month of September, the major stock market index tested a low, and then each week rose into resistance. As this stage, I suspect the level to watch for key support today will be 2151 on S&P 500 futures. The breakout level will likely be 2168, and a hold above this level will empower buyers to press the chart to higher levels. The environment remains tentative, and should not establish clear trend without retracement of breakouts or breakdowns.
See today’s economic calendar with a rundown of releases.
TODAY’S RANGE OF MOTION
S&P 500 Futures Trading Outlook For October 3
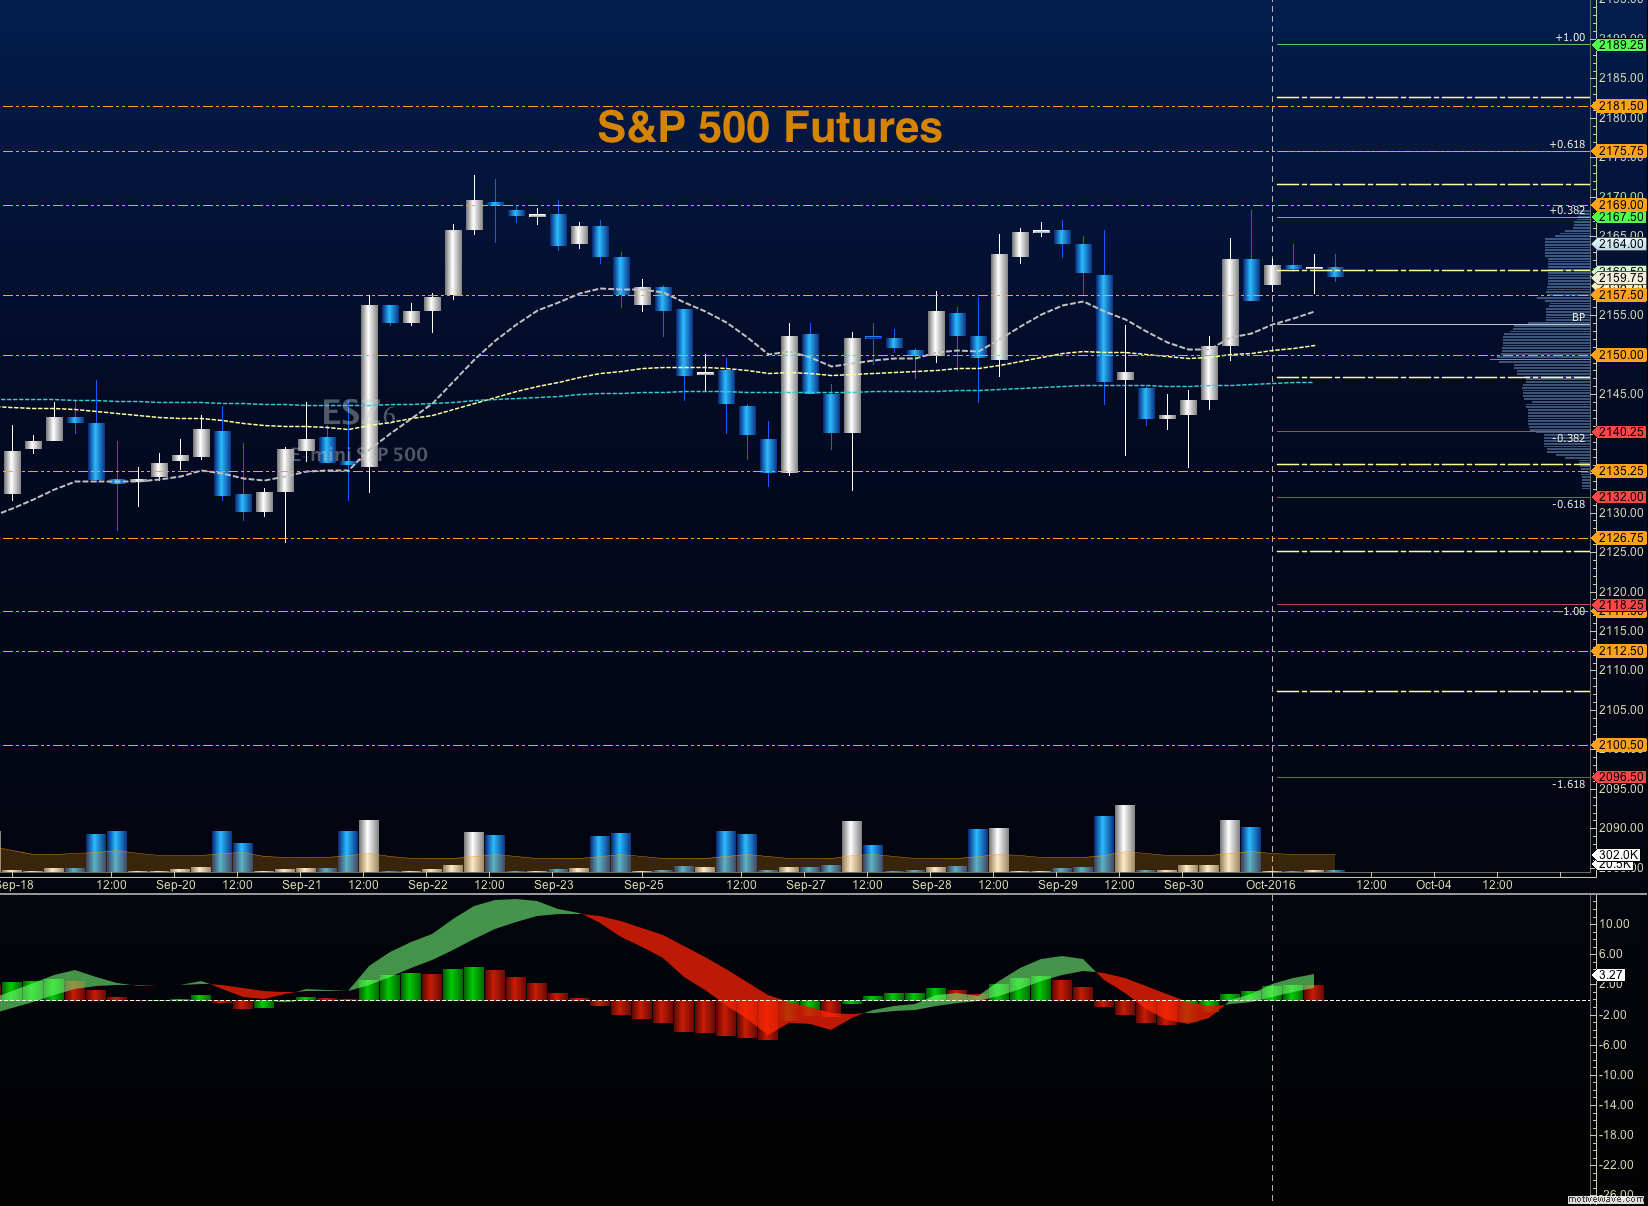
Upside trades on S&P 500 futures – Favorable setups sit on the positive retest of 2164, or a positive retest of the bounce off 2155.5 with upward momentum. Charts continue to be congested in these price ranges, so trading is likely to be choppy. I use the 30min to 1hr chart for the breach and retest mechanic. Targets from 2155.5 are 2159, 2161.5, 2164, 2167, 2169, 2171.5, 2174.5 and 2176.5.
Downside trades on S&P 500 futures – Favorable setups sit below the failed retest of 2154, or at the failed retest of 2157.5 with negative divergence. Retracements into lower levels from 2157.5 give us the targets 2154.25, 2151.5, 2148.25, 2145.5, 2141.75, 2137.5, 2135.75, 2132.75 and 2130.5.
Nasdaq Futures
The NQ_F also gave us an inside candle for the prior week. The higher breakout level is holding at 4850, with 4835 below that. Resistance sits between 4880 and 4890 today, and the weeks in September brought is higher lows, so we should expect a break higher – though sellers above may push the candles back down. Momentum is positive.
Upside trades – Favorable setups sit on the positive retest of 4874.75, or a positive retest of 4852.75 with positive momentum. I use the 30min to 1hr chart for the breach and retest mechanic. Targets from 4852.75 are 4857.5, 4860.5, 4864, 4867.5, 4870.25, 4874.25, 4874.75, 4876.25, 4880.25, 4884, and 4887.25 to 4890.
Downside trades on Nasdaq futures – Favorable setups sit below the failed retest of 4864, or at the failed retest of 4871.5 with negative divergence. Retracements into lower levels from 4871.5 are 4867.25, 4864.25, 4862, 4855.75, 4852, 4848.75, 4844, 4840.75, 4835.75, 4829.5, and 4824.75.
Crude Oil
Oil’s movement last week took us to the top of the current trading range. Resistance sits at 49.12 for the day, and support for the week should hold at 46.4. Buyers are holding an aggressive stance, and pullbacks ought to be bought. If the chart loses 47.7, which sits at the day’s support, but does not recapture quickly, sellers will advance into deeper support.
Trading ranges for crude oil should hold between 47.7 and 49.12 in the current pattern. Traders are increasingly skittish, so be very careful on the edges of these formations, as they could continue swiftly in the direction of motion.
Upside trades on crude oil futures can be staged on the positive retest of 48.7, or at a positive retest off 48.09 with positive momentum. I often use the 30min to 1hr chart for the breach and retest mechanic. Targets from 48.09 are 48.27, 48.54, 48.84, 49.04, 49.2, 49.48, 49.74, 49.92, and 50.12.
Downside trades on crude oil futures can be staged on the failed retest of 48.3, or at the failed retest of 48.8 with negative divergence. Targets from 48.8 are 48.44, 48.27, 48.08, 47.89, 47.74, 47.48, 47.14, 46.98, 46.71, 46.6, and 46.42.
If you’re interested in watching these trades go live, join us in the live trading room from 9am to 11:30am each trading day.
Visit TheTradingBook.com for more information.
If you’re interested in the live trading room, it is now primarily stock market futures content, though we do track heavily traded stocks and their likely daily trajectories as well – we begin at 9am with a morning report and likely chart movements along with trade setups for the day.
As long as the trader keeps himself aware of support and resistance levels, risk can be very adequately managed to play in either direction as bottom picking remains a behavior pattern that is developing with value buyers and speculative traders.
Twitter: @AnneMarieTrades
The author trades stock market futures every day and may have a position in mentioned securities at the time of publication. Any opinions expressed herein are solely those of the author, and do not in any way represent the views or opinions of any other person or entity.


