Stock Market Outlook for October 11, 2016 – Charts battle to break free of ranges
The tight range on the S&P 500 (INDEXSP:.INX) holds after a failed test of upper resistance. Buyers and sellers continue to battle near 2156 on S&P 500 futures. However, momentum is holding up after the higher low put in yesterday. The breakout level remains 2168. Price support levels hold at 2146 and then below at 2140, for now. The trading setup on the Nasdaq futures (see below) is quite different, and may lead the broader stock market indices higher.
See today’s economic calendar with a rundown of releases.
TODAY’S RANGE OF MOTION
S&P 500 Futures Trading Outlook For October 11
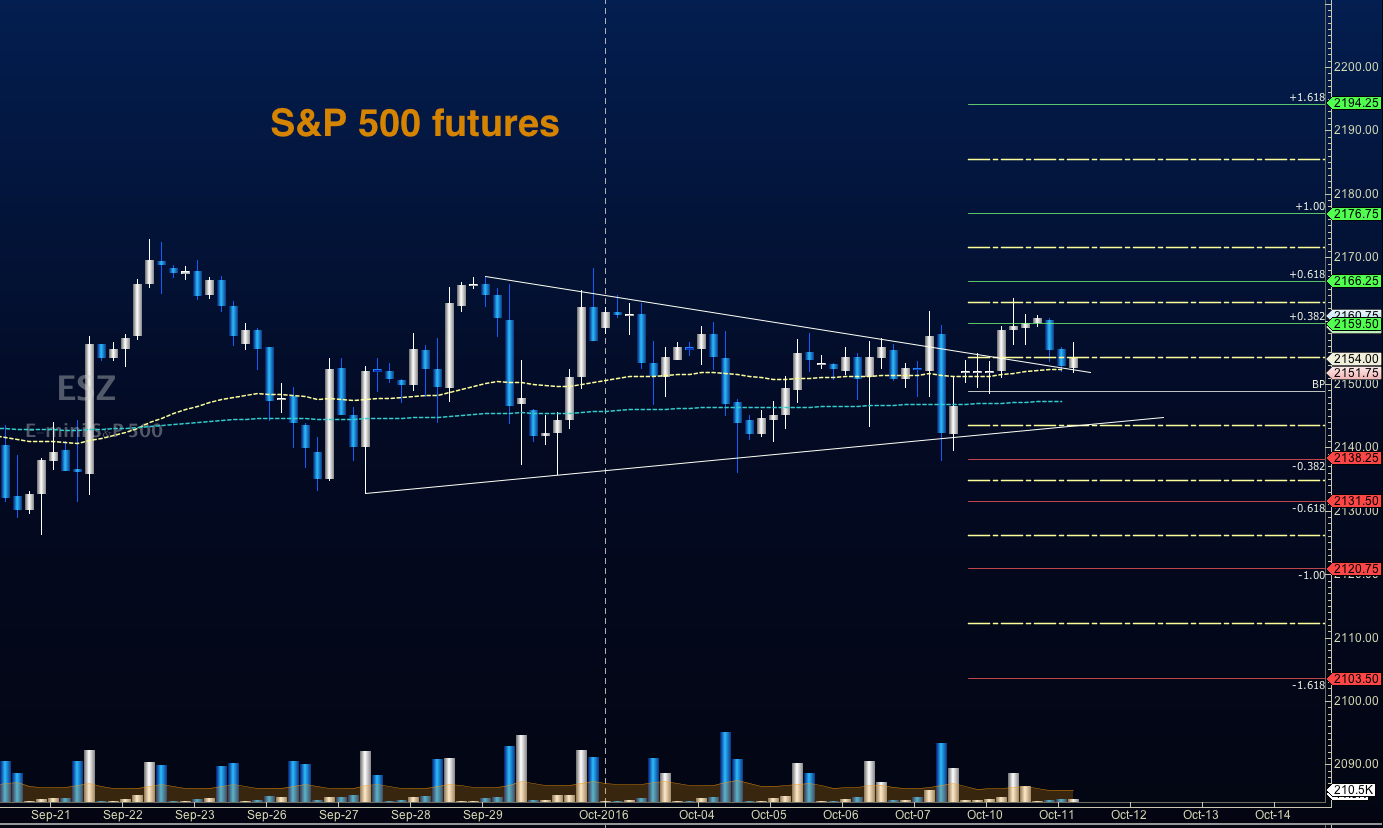
Upside trades on S&P 500 futures – Favorable setups sit on the positive retest of 2157.75, or a positive retest of the bounce off 2151.75 with upward momentum. Charts continue to be congested in these price ranges, so trading is likely to be choppy until the breach above 2164. I use the 30min to 1hr chart for the breach and retest mechanic. Targets from 2151.75 are 2155.5, 2157.5, 2160.25, 2163.25, 2167.5, and 2170.25 to 2174.5.
Downside trades on S&P 500 futures – Favorable setups sit below the failed retest of 2150.75, or at the failed retest of 2157.5 with negative divergence. Retracements into lower levels from 2157.5 give us the targets 2155.25, 2151.75, 2149.5, 2145.5, 2141.25, 2136.25, 2134.25, 2132.5 and 2130.5 to 2122.5.
Nasdaq Futures
The NQ_F bullish momentum is holding as price moves upward to test new highs, and higher resistance in the early morning. My notes in the Dropbox suggested this was the most bullish of the chart patterns, and even after the fade overnight, we hold above congestion. Another group of sellers sit near 4892. Support holds at 4879, with 4875, and 4865 below that. We sit in a well formed rising wedge.
Upside trades on Nasdaq futures – Favorable setups sit on the positive retest of 4897.25, or a positive retest of 4880.5 with positive momentum. I use the 30min to 1hr chart for the breach and retest mechanic. Targets from 4880.5 are 4884.25, 4887.25, 4890.75, 4892, 4894.75, 4897.25, and 4901 to 4907.5.
Downside trades on Nasdaq futures – Favorable setups sit below the failed retest of 4879.5, or at the failed retest of 4896.5 with negative divergence. Retracements into lower levels from 4893.5, 4890.5, 4887.5, 4884.75, 4881, 4878.5, 4874.5 are 4870.75, 4865.5, 4862.25, 4857.75, and 4852.75. See the blog for additional targets.
Crude Oil
Oil staged a monster bounce after OPEC and non OPEC countries got closer to agreeing on a curb to production. The API report is out tomorrow after the close. Sellers are sitting near 51.6, and near 51.07. Buyers should hold the pullbacks to support as most of the news stays bullish for now – new support sits at 50.60 to 50.35, but trades have been choppy at the edges of the formation.
Trading ranges on crude oil should hold between 50.14 and 51.9 in the current pattern.
Upside trades on crude oil futures can be staged on the positive retest of 51.11, or at a positive retest off 50.64 with positive momentum. I often use the 30min to 1hr chart for the breach and retest mechanic. Targets from 50.64 are 50.8, 51.02, 51.16, 51.36, 51.48, 51.64, and 51.87.
Downside trades on crude oil futures can be staged on the failed retest of 50.6, or at the failed retest of 51.05 with negative divergence. Targets from 51.05 are 50.91, 50.76, 50.62, 50.38, 50.24, 50.11, 49.84, 49.68, 49.57, 49.43, and 49.14.
If you’re interested in the live trading room, it is now primarily stock market futures content, though we do track heavily traded stocks and their likely daily trajectories as well – we begin at 9am with a morning report and likely chart movements along with trade setups for the day.
As long as the trader keeps himself aware of support and resistance levels, risk can be very adequately managed to play in either direction as bottom picking remains a behavior pattern that is developing with value buyers and speculative traders.
Twitter: @AnneMarieTrades
The author trades stock market futures every day and may have a position in mentioned securities at the time of publication. Any opinions expressed herein are solely those of the author, and do not in any way represent the views or opinions of any other person or entity.


