Stock Market Outlook for November 14, 2016 –
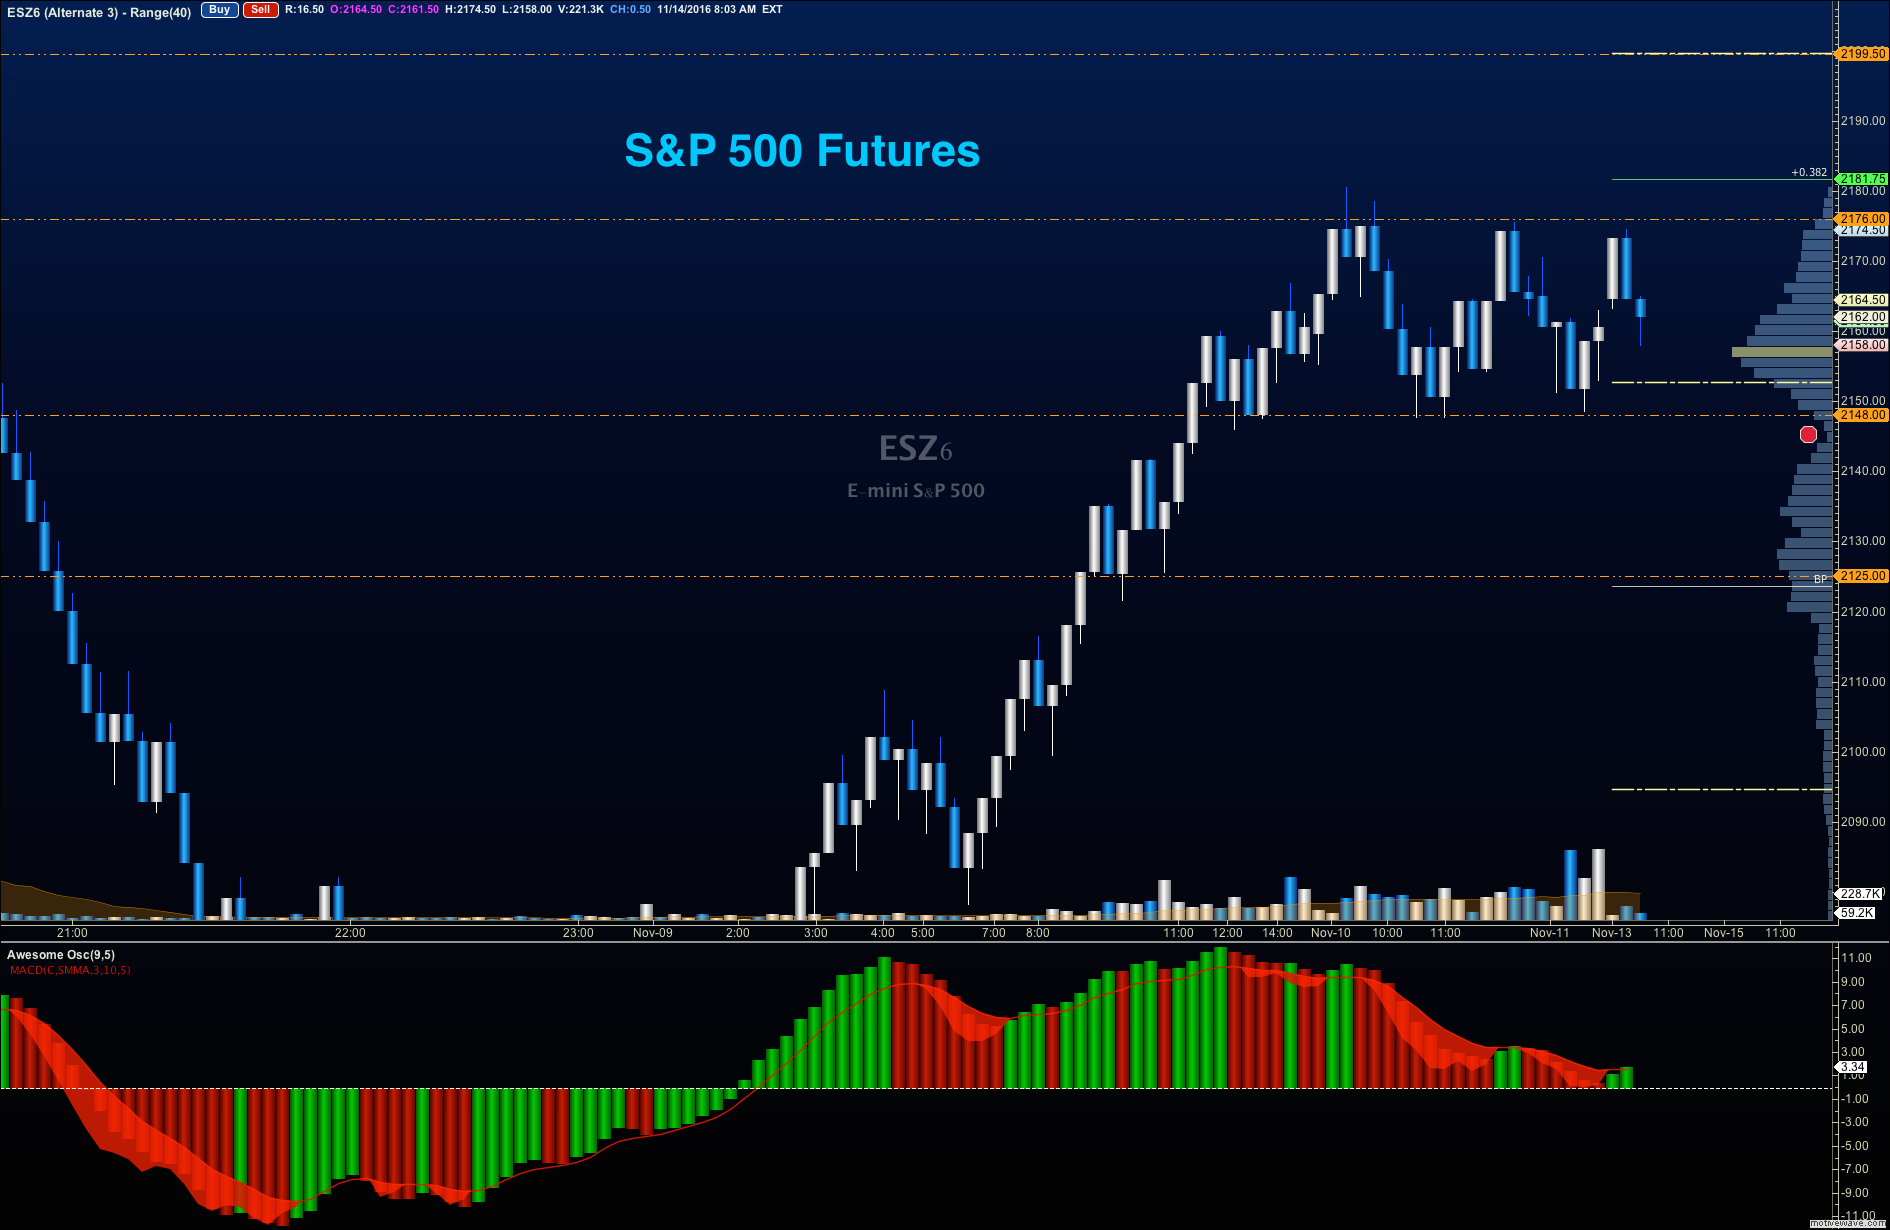
There are new lines in the sand that form another trading range on the S&P 500 (INDEXSP:.INX) for the week ahead. Looking at S&P 500 futures, we have price support levels near 2138 and resistance near 2187.75. I expect fades to hold support or recover from support, and that range expansions above 2187.75 to pull back. The line in the sand for buyers intraday will be 2151.50 – above there and buyers will command more power. Below 2148, and sellers will be in greater control of the motion. Stock market momentum is bullish, in general. Between those levels, we should have sideways action. Look for big wicks to continue. The region of low volume still remains of consequence, so it is very likely that we retest this area over the coming days.
See today’s economic calendar with a rundown of releases.
TODAY’S RANGE OF MOTION
S&P 500 Futures Trading Chart – November 14
Upside trades for S&P 500 futures – Two options for entry
Positive retest of continuation level -2167
Positive retest of support level– 2157
Opening targets ranges – 2160.50, 2165, 2166.75, 2170.50, and 2174.50
Downside trades for S&P 500 futures – Two options for entry
Failed retest of resistance level -2171.50
Failed retest of support level– 2156
Opening targets ranges – 2166.50, 2157.75, 2151.50, 2144.50, and 2138.50
Nasdaq Futures
The NQ_F feels somewhat weaker and is caught in congestion. Momentum is neutral, and price action is range bound between 4705 as support and 4798.5 as resistance. As momentum is neutral, we should see the best trades on the edges near resistance.
Upside trades for Nasdaq futures – Two options
Positive retest of continuation level -4779.50
Positive retest of support level– 4707.50
Opening targets ranges – 4718.50, 4730.50, 4751.75, 4762.25, 4774, 4779.5, 4784, and 4798.5
Downside trades for Nasdaq futures – Two options
Failed retest of resistance level -4756.50
Failed retest of support level– 4725.50
Opening targets ranges – 4742.50, 4738.25, 4725.50, 4719.50, 4710.25, and 4705.50
Oil –WTI_Crude
Oil prices remain heavy under the weight of news, and continue to collapse under the weight of sellers. Support targets now look like 41.85, while resistance levels remain near 45.38. Momentum has drifted lower.
Upside trades for Crude Oil – Two options
Positive retest of continuation level -43.72
Positive retest of support level– 42.6
Opening targets ranges -43.16, 43.68, 44.32, 44.87, 45.06, and 45.32
Downside trades for Crude Oil – Two options
Failed retest of resistance level -43.41
Failed retest of support level– 42.45
Opening targets ranges – 43.08, 42.7, 42.45, 42.12, and 41.86
If you’re interested in watching these trades go live, join us in the live trading room from 9am to 11:30am each trading day.
Visit TheTradingBook for more information.
If you’re interested in the live trading room, it is now primarily stock market futures content, though we do track heavily traded stocks and their likely daily trajectories as well – we begin at 9am with a morning report and likely chart movements along with trade setups for the day.
As long as the trader keeps himself aware of support and resistance levels, risk can be very adequately managed to play in either direction as bottom picking remains a behavior pattern that is developing with value buyers and speculative traders.
Twitter: @AnneMarieTrades
The author trades stock market futures every day and may have a position in mentioned securities at the time of publication. Any opinions expressed herein are solely those of the author, and do not in any way represent the views or opinions of any other person or entity.

: Cup (and Maybe Handle) Watch")
 Trading Near Top Of Price Range")

