Stock Market Futures Considerations For June 20, 2017
Late Monday afternoon we saw buyers come in and the S&P 500 (INDEXSP:.INX) surged past resistance levels. The charts pushed to new highs on S&P 500 futures (ES) and the S&P 500 cash index.
Check out today’s economic calendar with a full rundown of releases. And note that the charts below are from our premium service at The Trading Book and are shared exclusively with See It Market readers.
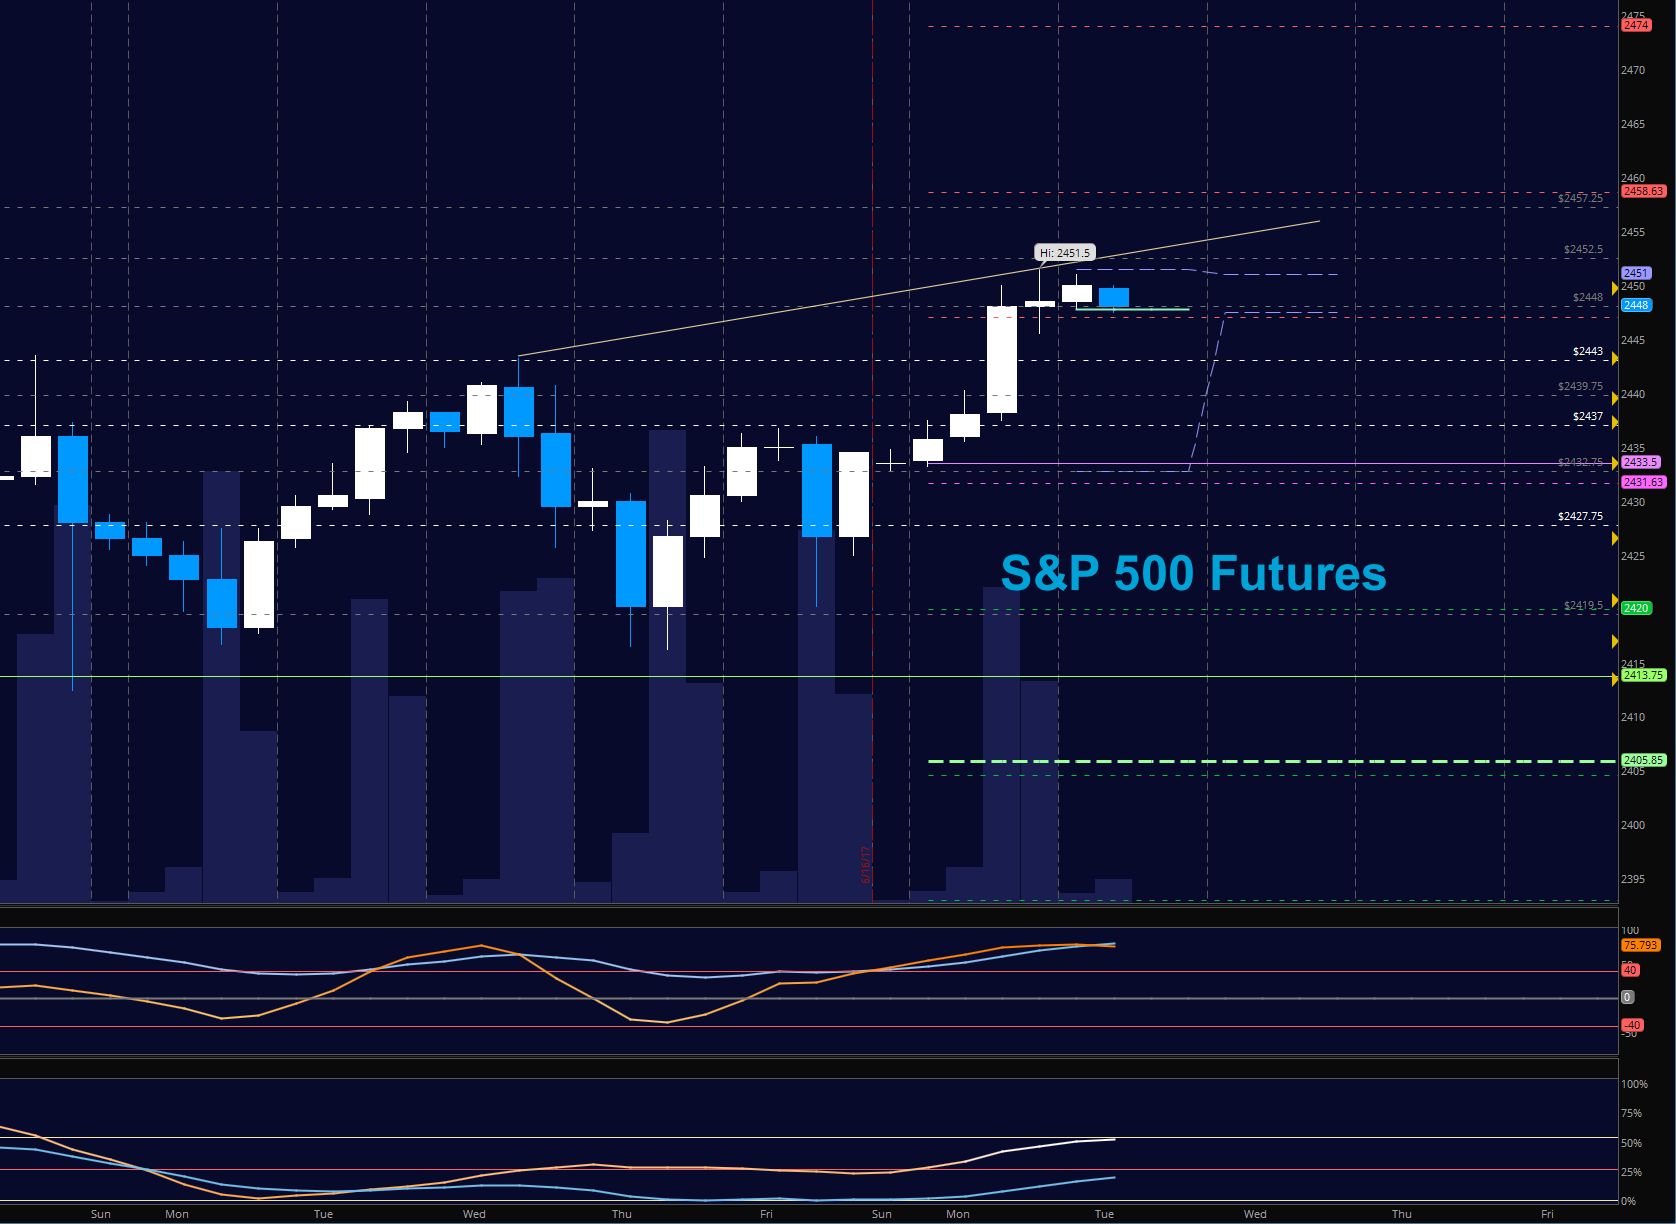
S&P 500 Futures (ES)
With a big breach over prior highs and generally positive momentum, our pullbacks will see buyers. Range bound motion continues this morning as we approach resistance once more. A fade to higher lows is most reasonable to assume today but holding 2443 will be important. Support intraday has shifted up to 2437 but could break before recovering as we hold bullish intraday formations for now. The bullets below represent the likely shift of trading momentum at the positive or failed retests at the levels noted.
- Buying pressure intraday will likely strengthen above a positive retest of 2451.5
- Selling pressure intraday will likely strengthen with a failed retest of 2437
- Resistance sits near 2452.5 to 2457.5, with 2458.75 and 2464.5 above that.
- Support holds between 2443 and 2437.25, with 2432.5 and 2427.5 below that.
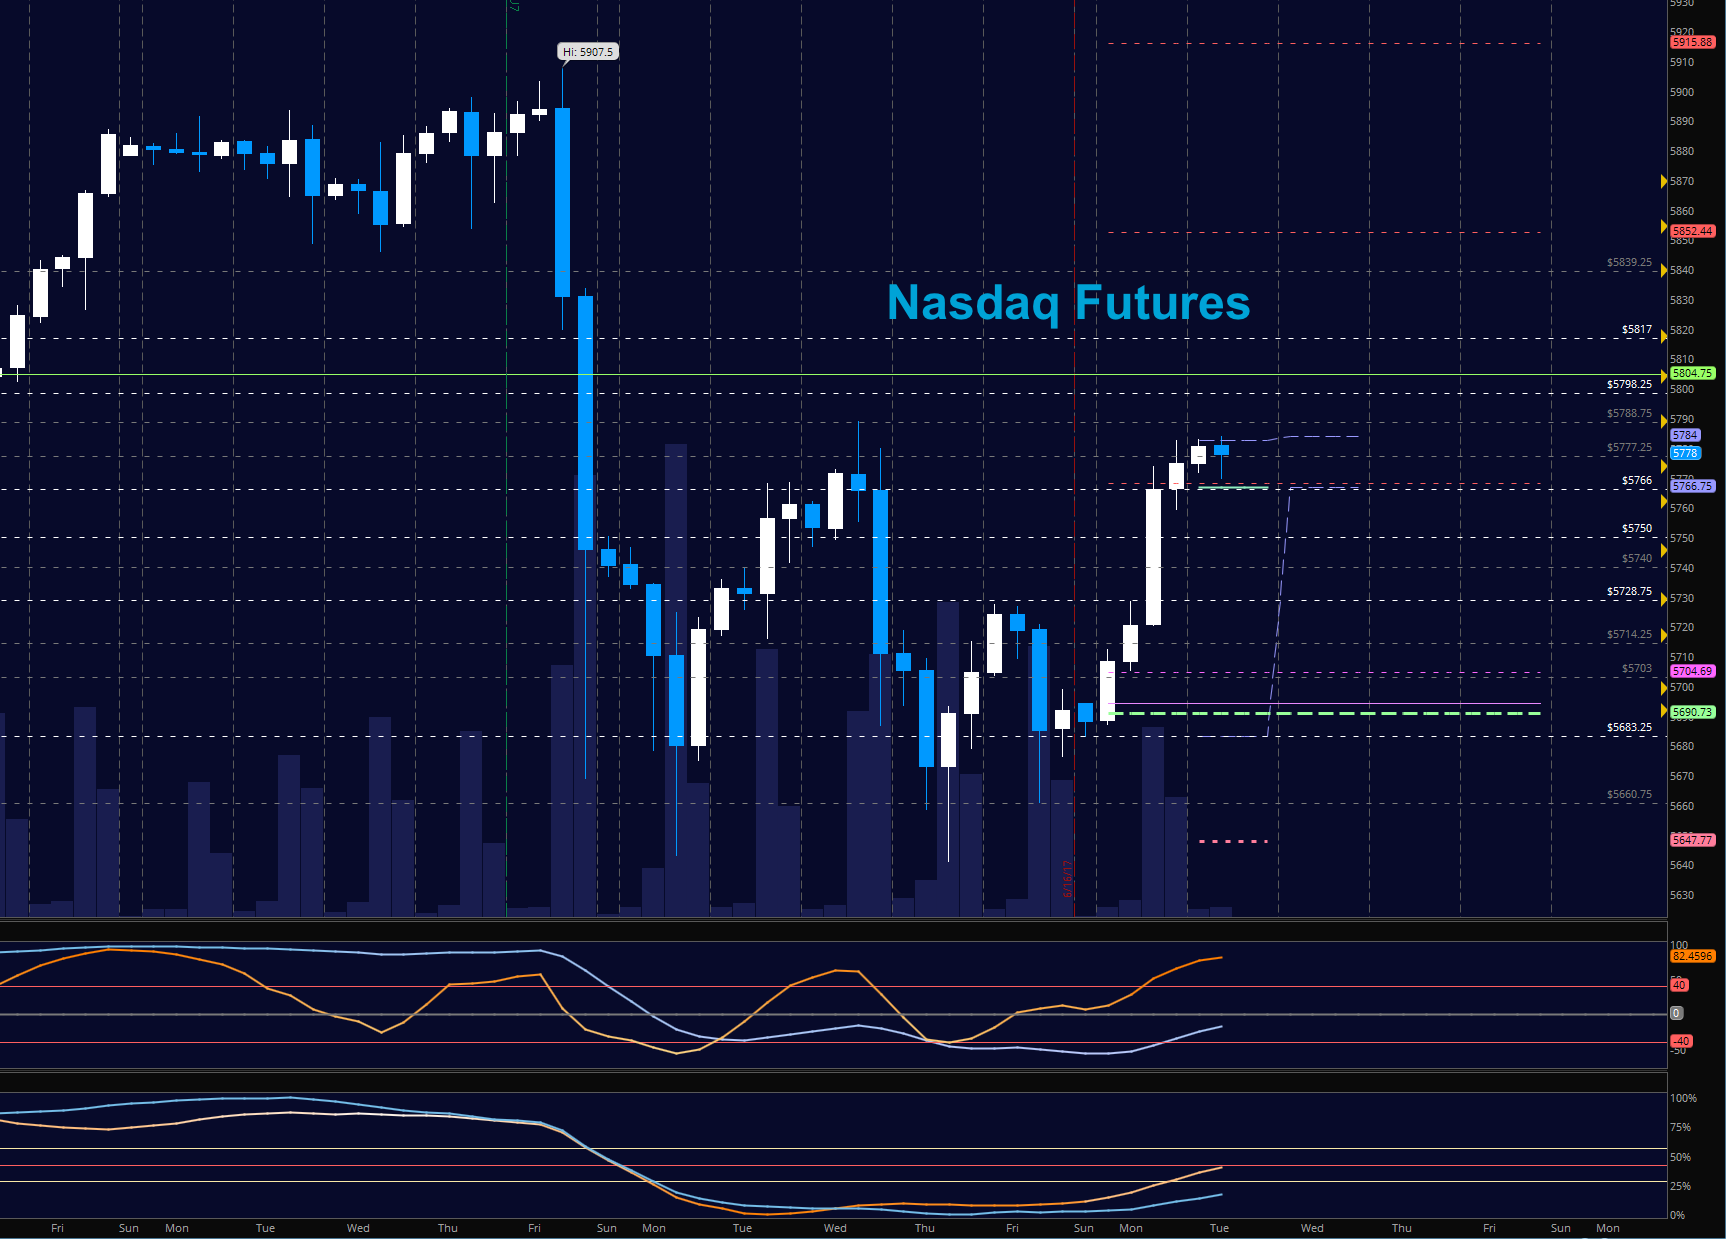
NASDAQ Futures (NQ)
Tech is grinding through recovery and tested resistance at 5784. Above 5488 and we should move above 5804, and below 5766, we’ll fade through to at least 5740. There is a battle being waged at 5777.25 and pullbacks should find buyers on the first pass. The bullets below represent the likely shift of intraday trading momentum at the positive or failed tests at the levels noted.
- Buying pressure intraday will likely strengthen with a positive retest of 5788.75
- Selling pressure intraday will likely strengthen with a failed retest of 5762.25
- Resistance sits near 5788.75 to 5798.25, with 5804.5 and 5814.5 above that.
- Support holds between 5760.25 and 5742.5, with 5728.25 and 5704.75 below that.
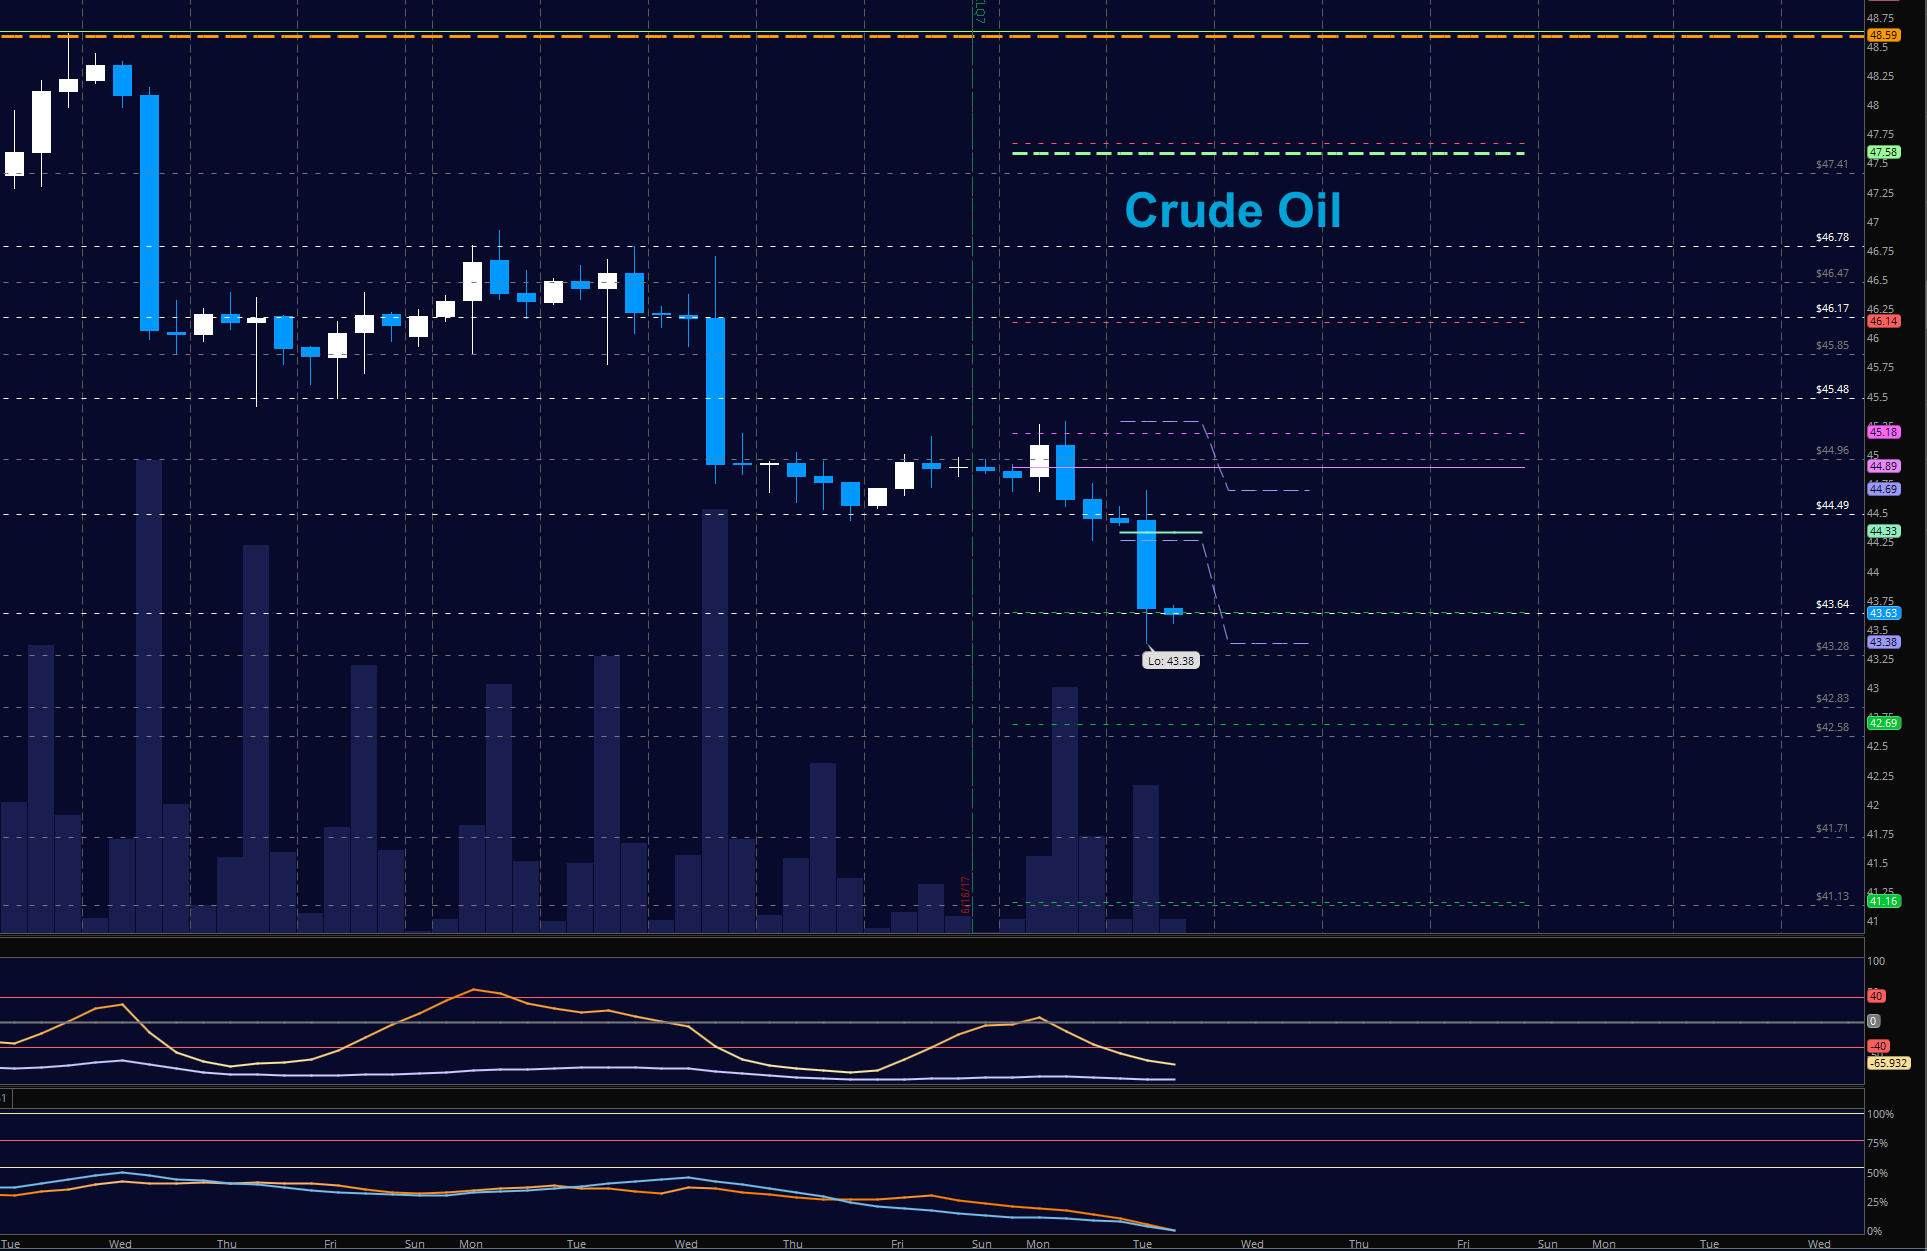
WTI Crude Oil
Sharp selling continues in a very negative environment. A Fibonacci formation projects a fade into 41 or so, but it is much better to short at resistance rather than exposure capital to risk events that are clearly visible. After a failed test of 45.2, we have fallen to another area of support near 43.4. Buyers are likely to attempt a move above 44.6, but below that sellers are clearly in charge, and bounces will very likely fall into lower levels. The bullets below represent the likely shift of trading momentum at the positive or failed tests at the levels noted.
- Buying pressure intraday will likely strengthen with a positive retest of 44.6
- Selling pressure intraday will strengthen with a failed retest of 43.25
- Resistance sits near 44.25 to 44.6, with 45.2 and 45.48 above that.
- Support holds between 44.3 to 44.17, with 43.65 and 43.07 below that.
Twitter: @AnneMarieTrades
The author trades stock market futures every day and may have a position in mentioned securities at the time of publication. Any opinions expressed herein are solely those of the author, and do not in any way represent the views or opinions of any other person or entity.

: Creating Bullish Divergence?")


: Creating Bullish Divergence?")

