Stock Market Futures Trading Considerations for June 13, 2017
The S&P 500 Index (INDEXSP:.INX) is rebounding and looks poised to test key price resistance. A breakout will lead to a test of higher price regions. Read below for more details.
Check out today’s economic calendar with a full rundown of releases. And note that the charts below are from our premium service at The Trading Book and are shared exclusively with See It Market readers.
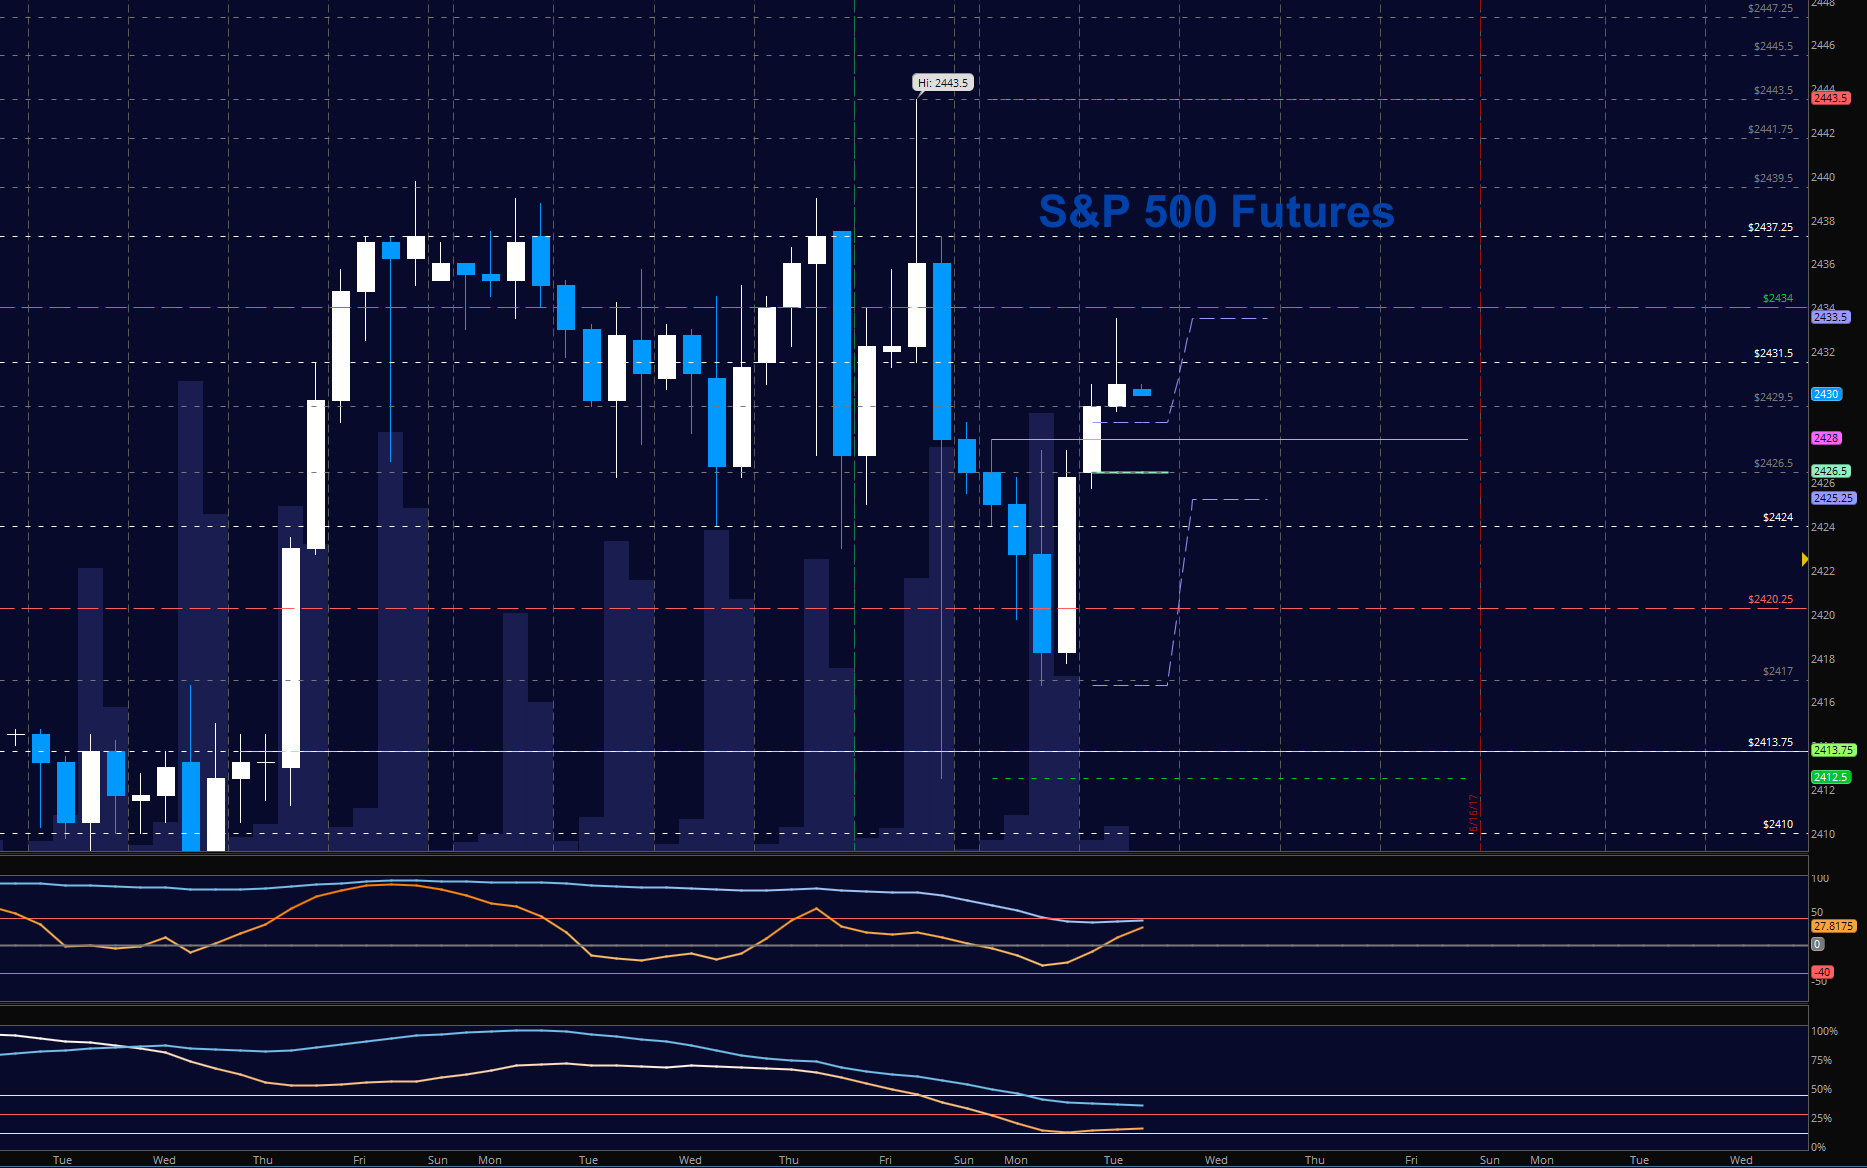
S&P 500 Futures (ES)
After a morning sell off, the ES_F rebounded back into congestion area. Support is back up at 2425 with resistance at the familiar at 2434. The bullets below represent the likely shift of trading momentum at the positive or failed retests at the levels noted.
- Buying pressure intraday will likely strengthen above a positive retest of 2434
- Selling pressure intraday will likely strengthen with a failed retest of 2420.5
- Resistance sits near 2434 to 2437.75, with 2441.75 and 2445.5 above that.
- Support holds between 2420.5 and 2413.5, with 2410.5 and 2407.75 below that.
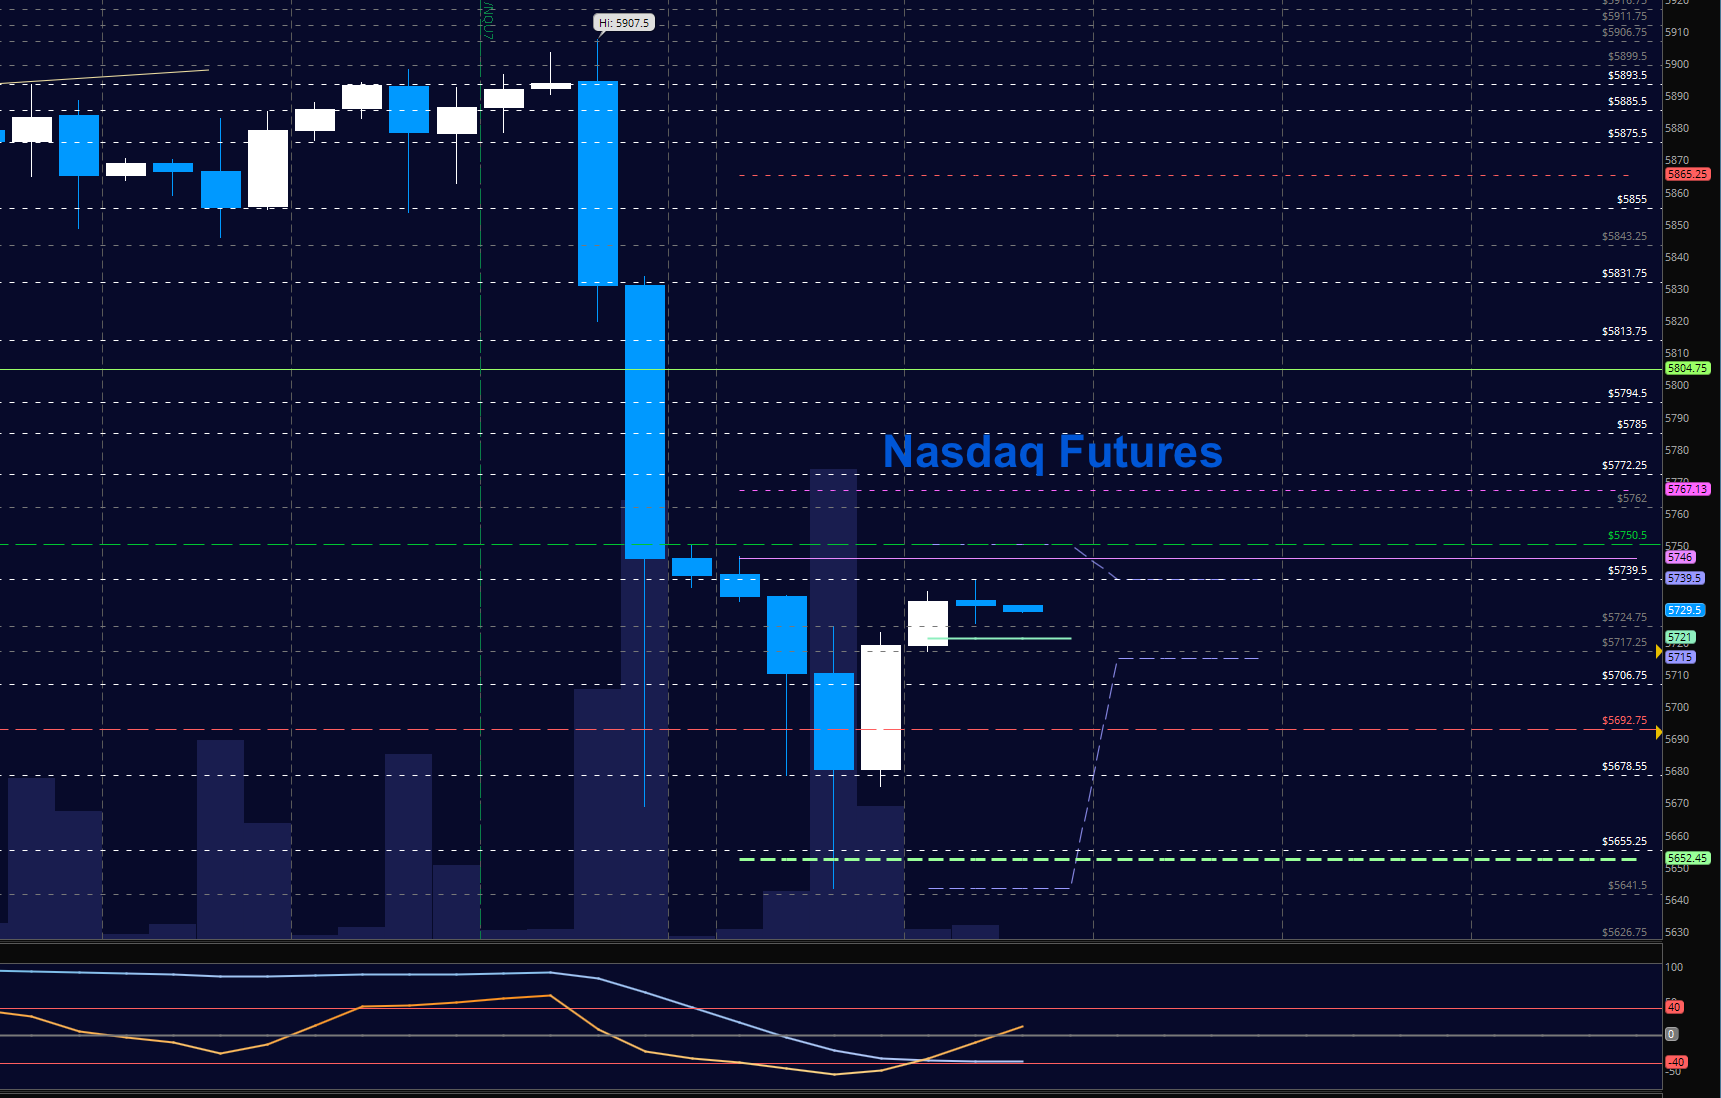
NASDAQ Futures
The NQ_F dipped lower into the weekly 10 SMA of the composite chart before bouncing. The chart has yet to recover above a key level above 5750- key resistance. Support to hold is 5690 and above that is 5706. The bullets below represent the likely shift of intraday trading momentum at the positive or failed tests at the levels noted.
- Buying pressure intraday will likely strengthen with a positive retest of 5740
- Selling pressure intraday will likely strengthen with a failed retest of 5690
- Resistance sits near 5744 to 5750.5, with 5762.5 and 5772.25 above that.
- Support holds between 5690.25 and 5668.75, with 5645.5 and 5609.25 below that.
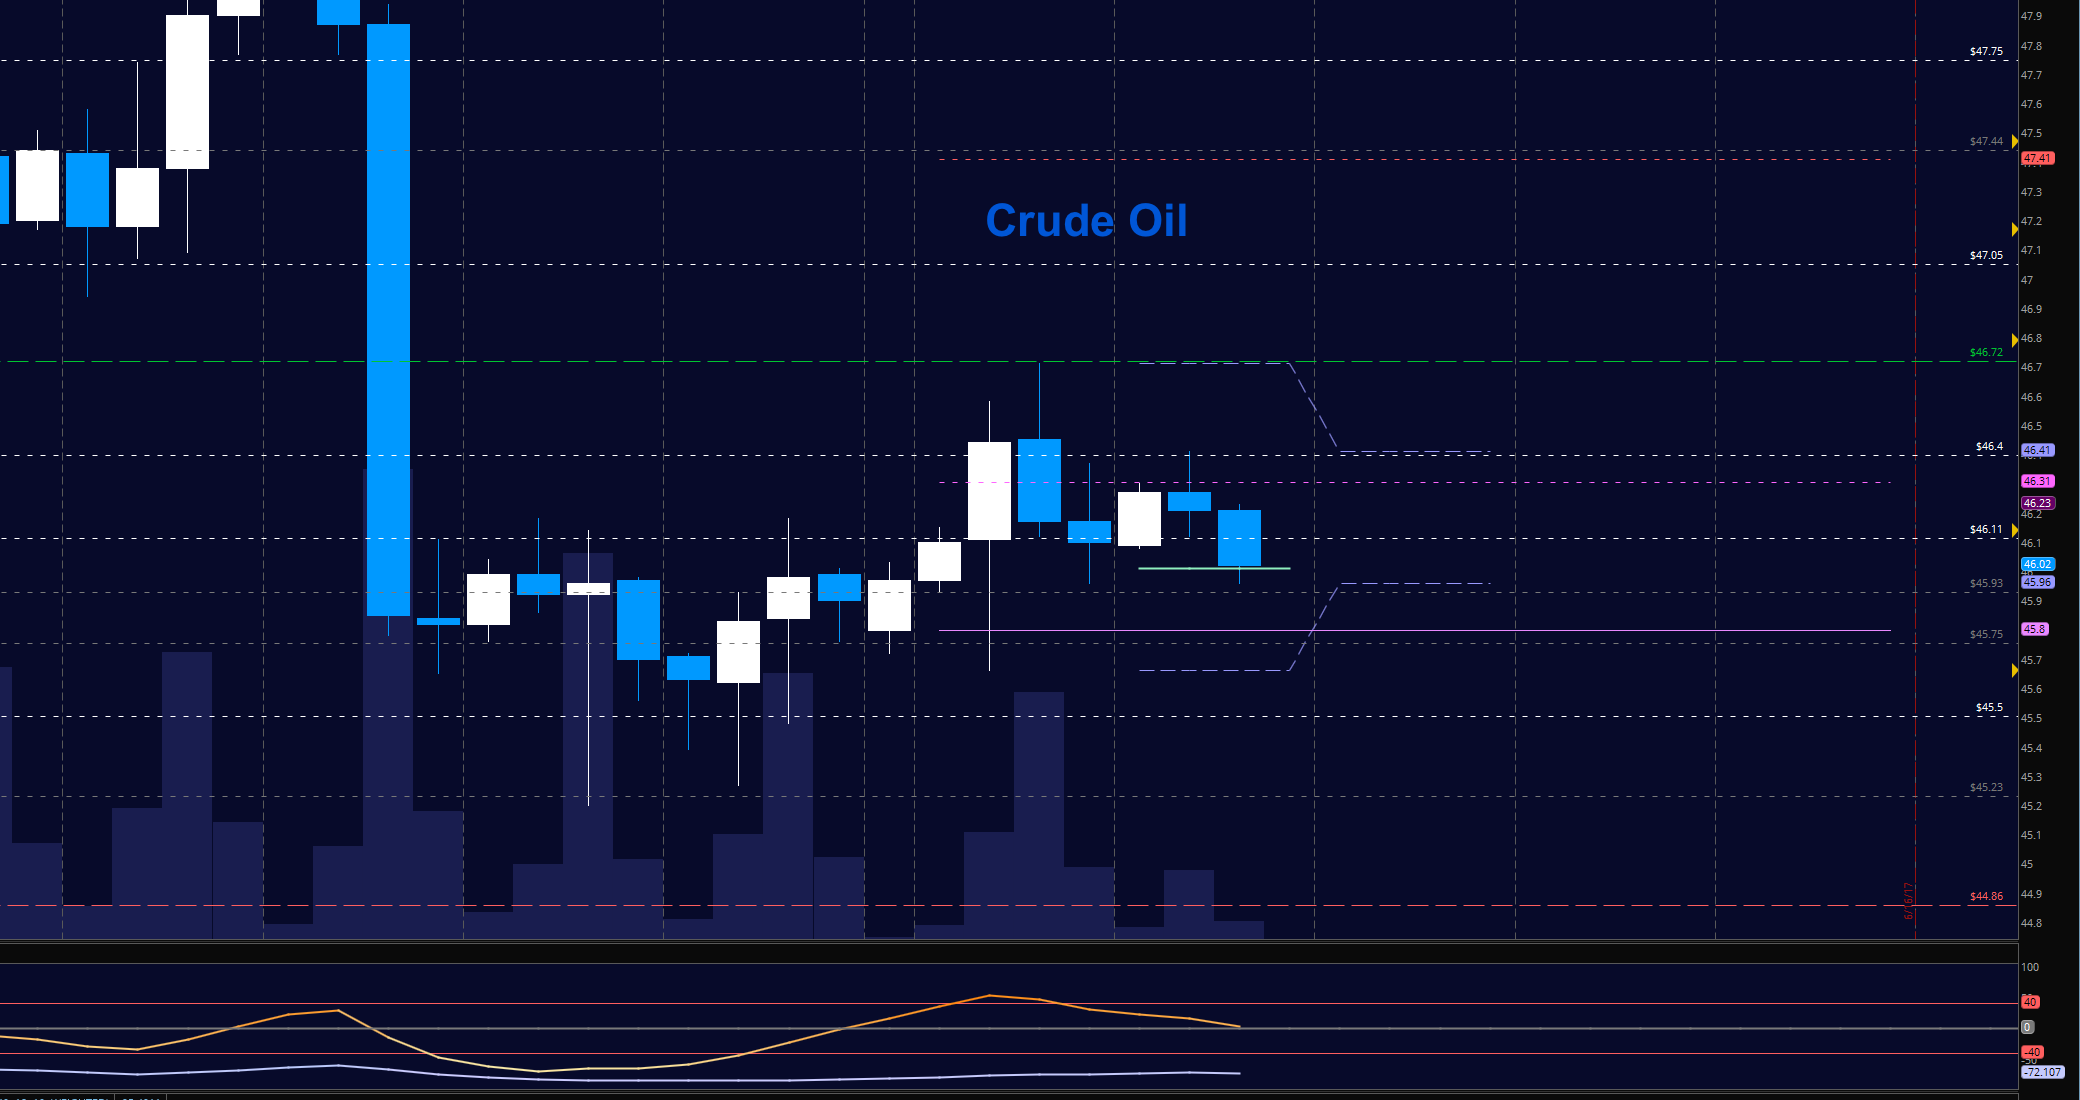
WTI Crude Oil
Congestion holds price bound between 45.5 and 46.72, with sellers now sitting near 46.4. API and EIA reports are on the horizon and they Momentum is mixed suggesting range bound trading setups are best. The bullets below represent the likely shift of trading momentum at the positive or failed tests at the levels noted.
- Buying pressure intraday will likely strengthen with a positive retest of 46.42
- Selling pressure intraday will strengthen with a failed retest of 45.75
- Resistance sits near 46.78 to 47.05, with 47.4 and 48.08 above that.
- Support holds between 45.5 to 45.27, with 44.86 and 44.46 below that.
Our live trading room is now primarily stock market futures content, though we do track heavily traded stocks and their likely daily trajectories as well – we begin at 9am with a morning report and likely chart movements along with trade setups for the day.
As long as the trader keeps himself aware of support and resistance levels, risk can be very adequately managed to play in either direction as bottom picking remains a behavior pattern that is developing with value buyers and speculative traders.
Twitter: @AnneMarieTrades
The author trades stock market futures every day and may have a position in mentioned securities at the time of publication. Any opinions expressed herein are solely those of the author, and do not in any way represent the views or opinions of any other person or entity.


