Stock Market Futures Outlook for July 5, 2016 – This week will be a short week. And after being able to reflect on volatile swings, it seems that we will continue the seismic market behavior. Considering the severity of the 2-day Brexit vote decline, it was nearly amazing to see the S&P 500 Index up 3.3% last week.
From a longer-term perspective, buyers will be most comfortable assisting the recovery as long as the weekly moving averages hold inside the congestion zones. S&P 500 futures trading support sits at 2062.25-2066. Momentum today suggests that we find buyers on pullbacks into support. Selling could intensify if we lose 2082 and fail to recapture it quickly. S&P 500 futures trading resistance sits near 2097-2102.5. Buyers are still clearly in charge, but won’t be very aggressive below 2095.75, as there is a band of sellers right at the 2095.25 waiting today.
See today’s economic calendar with a rundown of releases.
RANGE OF TODAY’S MOTION
E-mini S&P Futures
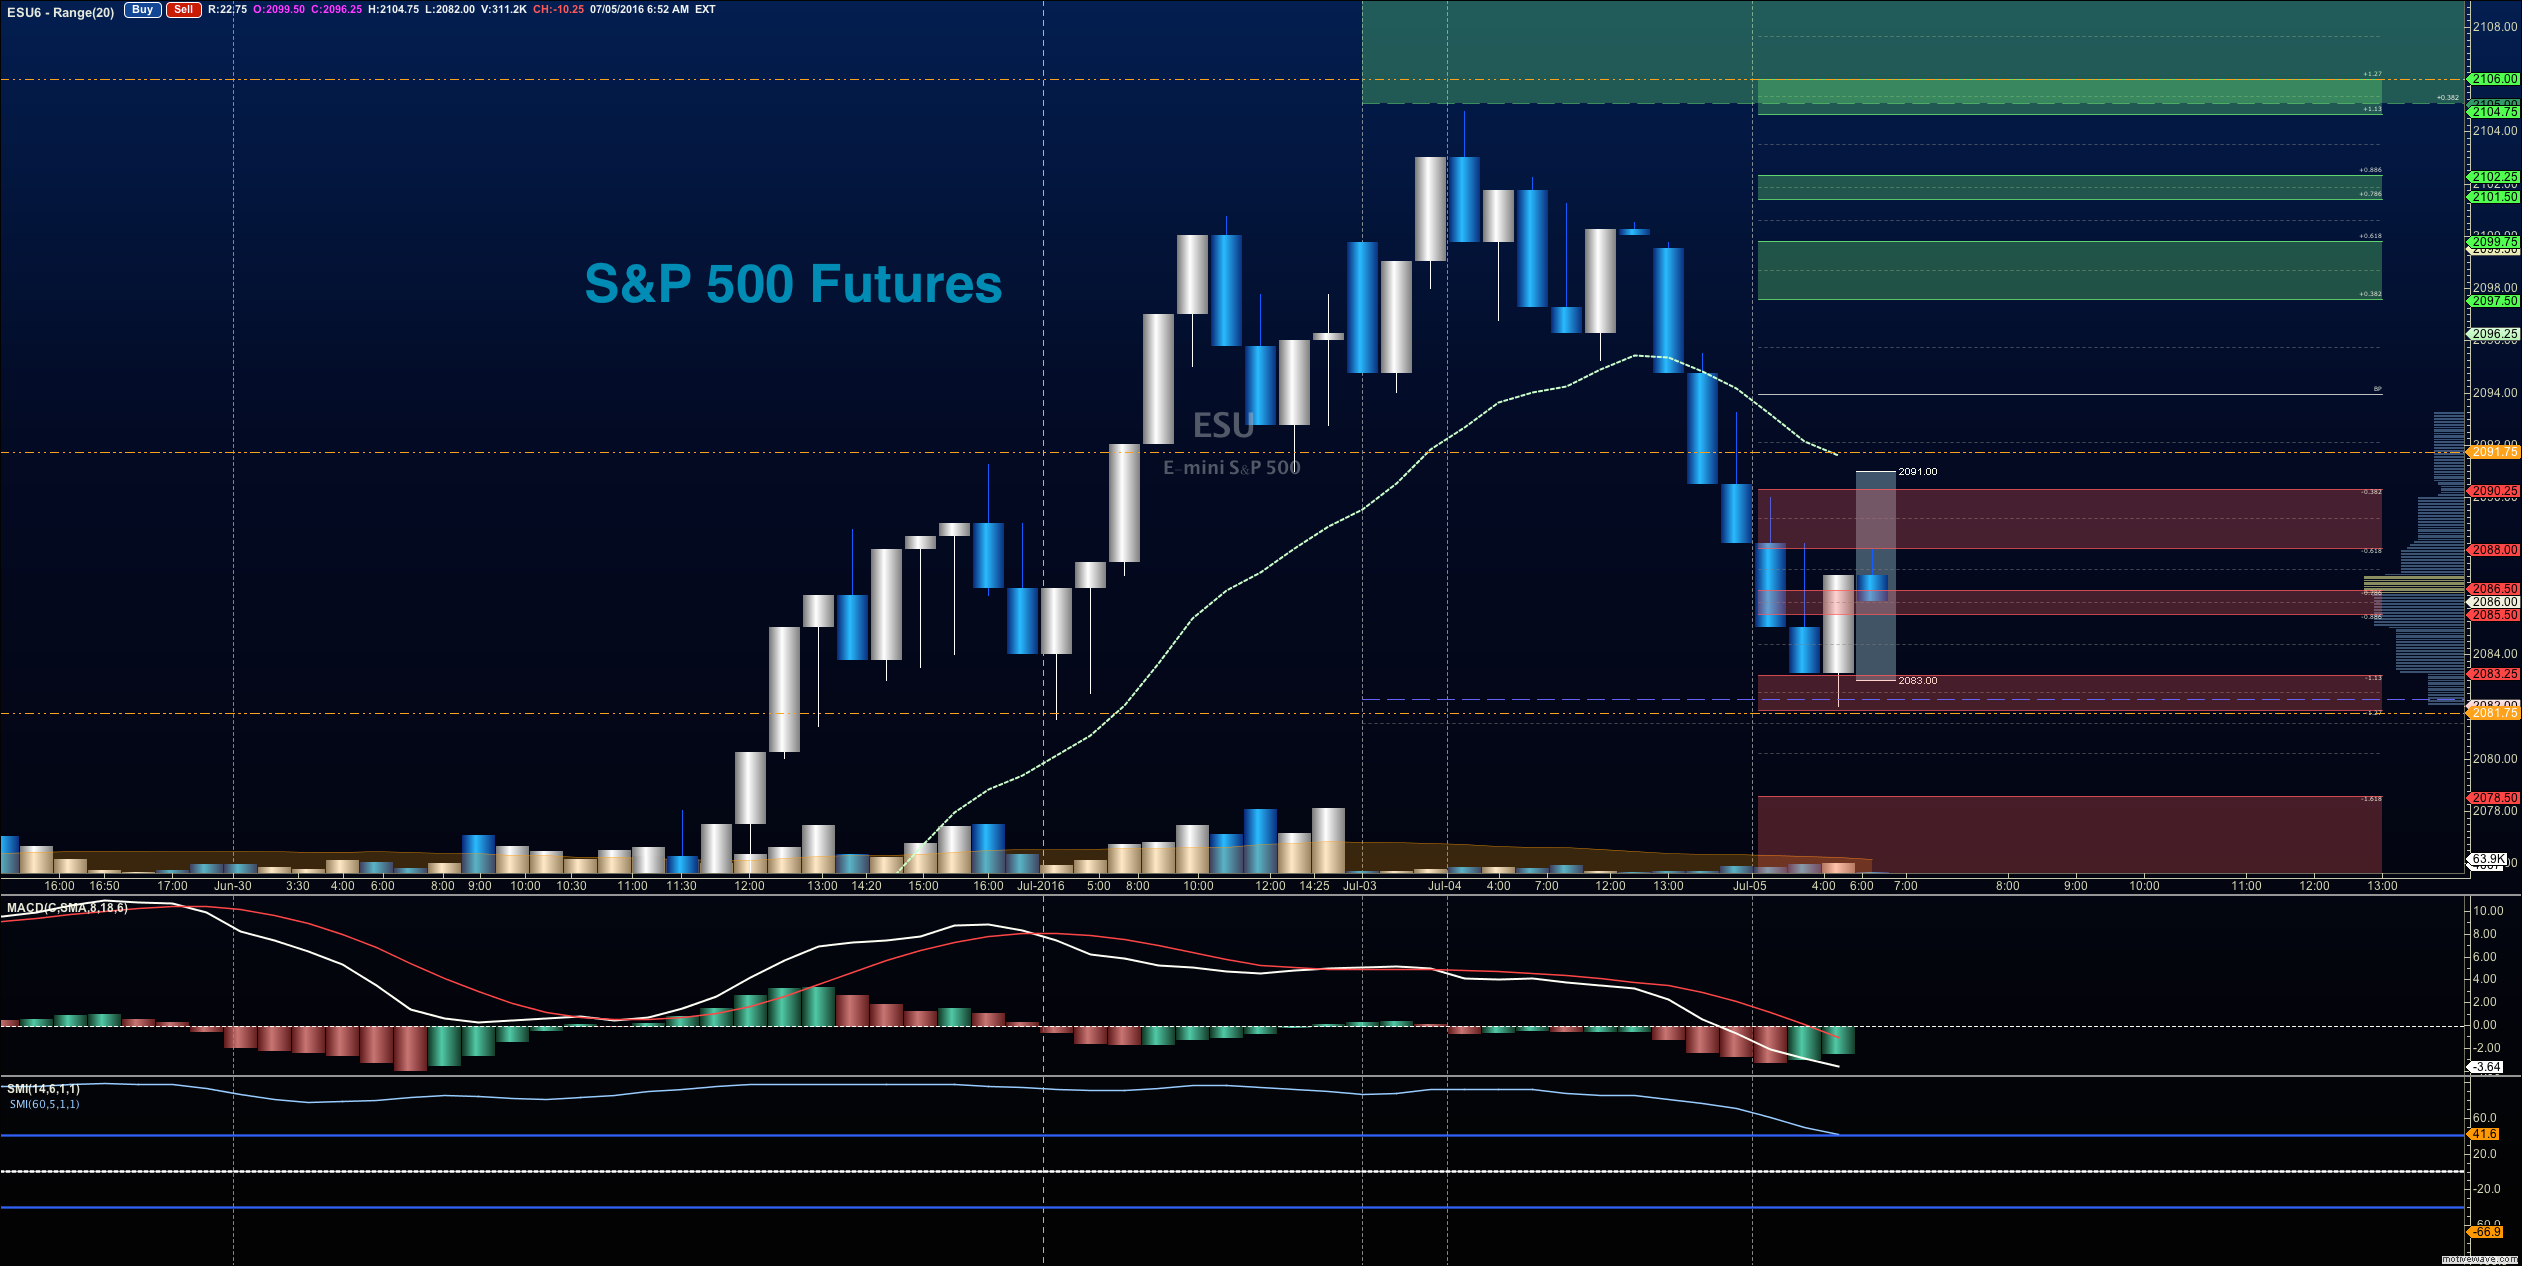
S&P 500 Futures Trading Outlook for July 5, 2016 –
Upside trades on S&P 500 futures – Favorable setups sit on the positive retest of 2089.5, or a positive retest of the bounce off 2082 with positive momentum. Be very careful watching for sellers showing up near 2094.75, as failure there could signal that sellers might try to resume power. Buying power remains strong, but charts have come into support near that 2082 region – a very familiar one, if you read these posts often. I use the 30min to 1hr chart for the breach and retest mechanic. Targets from 2082 are 2086, 2089.5, 2091.25, 2093.5, 2097.25, 2099.75, 2101.75, and if we expand again, we could stretch to 2107.75 and 2112.5.
Downside trades on S&P 500 futures – Favorable setups sit below the failed retest of 2081 or at the failed retest of 2095.25 with negative divergence. It is important to watch for higher lows to develop with the 2095.25 entry, as the chart may be attempting a retest of the recent high under the current bullish environment. Retracement into lower levels from 2095.25 gives us the targets 2091.25, 2089.5, 2086.25, 2082.5, 2078.75, 2075.25, 2071.75, 2068.75, and 2064.25 to 2061.5, if sellers take over.
Nasdaq Futures
Nasdaq Futures Trading Outlook for July 5, 2016 (NQ_F) – Nasdaq futures is bouncing off a major support area near 4404. The band of support is actually about 10 points wide, stretching into 4394. This ten point range is the region to watch over the coming days and weeks. My suspicion is that we stage a few bounces off this area, but based on momentum, we will likely fail the area as we drift deeper into the summer. Today, support is near 4393.5, and if sellers press further, deeper support lies near 4372. Resistance lies near the very familiar 4431-4434 congestion zone.
Upside trades on Nasdaq futures – Favorable setups sit on the positive retest of 4412.5, or a positive retest of 4403.5 with positive momentum. I use the 30min to 1hr chart for the breach and retest mechanic. Watch for the lower high to develop near 4424, if sellers try to take over intraday. Targets from 4403.5 are 4408.75, 4410.75, 4412.5, 4415, 4420.5, 4424.25, 4431.25, 4435.75, 4438.5, 4446.25, 4451.5, and 4464.5, if buyers overpower the line of sellers in the way.
Downside trades on Nasdaq futures – Favorable setups sit below the failed retest of 4403.5 or at the failed retest of 4428.5 with negative divergence. Retracement into lower levels from 4428.5 gives us the targets 4424.75, 4419.75, 4414.5, 4410.75, 4408.75, 4403.5, 4398, 4395.5, 4391.5, 4389.5, 4386.25, 4384, 4378.25, and 4370.75 to 4364.75; if sellers resume control.
Crude Oil
Crude Oil Futures Trading Outlook for July 5, 2016 (CL_F) –
Oil prices will be stretched by traders looking at supply line issues and those looking at the EU Referendum fallout. Trading range suggests support action near 47.02, and resistance behavior near 49.35.
Upside trades on crude oil futures can be staged on the positive retest of 48.56, or at a bounce off 47.74 with positive momentum. I often use the 30min to 1hr chart for the breach and retest mechanic. Targets from 47.74 are 48.12, 48.34, 48.56, 48.84, 49.04, 49.28, 49.54, 49.9, 50.14, 50.32, and 50.54.
Downside trades on crude oil futures can be staged on the failed retest of 47.4, or at the failed retest of 48.46 with negative divergence. Targets from 48.46 are 48.34, 48.16, 47.98, 47.74, 47.48, 47.13, 46.89, 46.7, 46.44, and perhaps 46.27 to 45.87, though that continues to seem unlikely at this time, as congestion holds.
If you’re interested in the live trading room, it is now primarily stock market futures content, though we do track heavily traded stocks and their likely daily trajectories as well – we begin at 9am with a morning report and likely chart movements along with trade setups for the day.
As long as the trader keeps himself aware of support and resistance levels, risk can be very adequately managed to play in either direction as bottom picking remains a behavior pattern that is developing with value buyers and speculative traders.
Twitter: @AnneMarieTrades
The author trades stock market futures every day and may have a position in mentioned securities at the time of publication. Any opinions expressed herein are solely those of the author, and do not in any way represent the views or opinions of any other person or entity.


