S&P 500 Trading Outlook for July 19, 2016 – We begin a fourth day in the same trading range. It is suggested that several days in a trading range will lead to either a breakout or a breakdown. And today, the momentum is decidedly down across stock market futures trading. This usually leads to a chart failing its bounces – we’ll see if the S&P 500 futures have enough to muster another rally before a pullback.
This market is still trapped between price support near 2153 and resistance near 2163. This morning, the buyers have swooped in at any tests near 2153, but the failure to breach 2158 could yield a tidy downside into 2145-2146. The moving averages continue to flatten, and now sit above price in several time frames (mildly bearish). Price support on S&P 500 futures to watch below 2151 would be 2145.5 and 2139.5. Price resistance above 2163 sits near 2167.75 to 2178.75.
See today’s economic calendar with a rundown of releases.
RANGE OF TODAY’S MOTION
S&P 500 Futures July 18 – Trading Chart (ES_F)
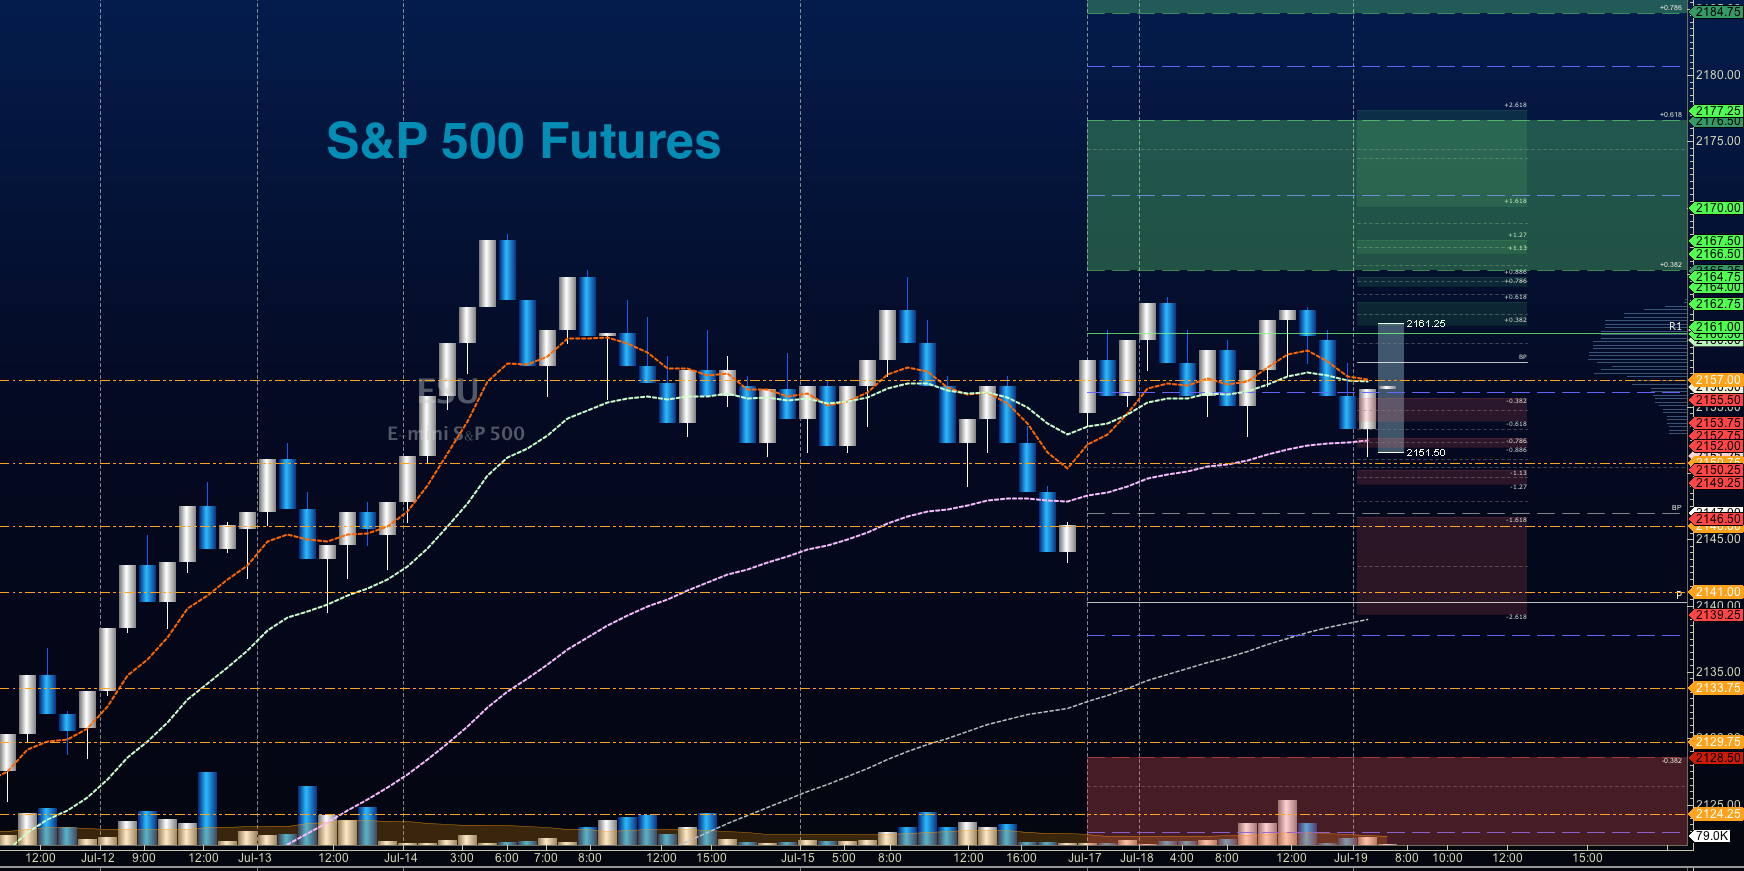
Upside trades on S&P 500 futures – Favorable setups sit on the positive retest of 2159.5, or a positive retest of the bounce off 2151.5 with positive momentum. Keep an eye out for lower highs to set in, as this could signal that sellers are collecting strength. I use the 30min to 1hr chart for the breach and retest mechanic. Targets from 2151.5 are 2154.25, 2157.5, 2161.5, 2163.25, 2167.5, 2171.5, 2175.75, and if we expand, we are likely to stretch above into 2179.75.
Downside trades on S&P 500 futures – Favorable setups sit below the failed retest of 2151 or at the first failed retest of 2160.5 with negative divergence. As this is still a countertrend trade (though not as much as yesterday), keep your eyes on the lookout for higher lows developing intraday. Retracement into lower levels from 2160.5 gives us the targets 2157.75, 2155.5, 2151.5, 2147.75, 2145.75, 2143, 2141.75, 2138.75, 2136.5, 2134.5, 2128.25, 2124.5, 2122.75, and 2120.75 to 2118.5, if sellers take over.
If you’re interested in watching these trades go live, join us in the live trading room from 9am to 11:30am each trading day.
Nasdaq Futures (NQ_F)
The NQ_F continues range bound activity with resistance above near 4598.75 to 4618.25, and support near 4570, with a lower break into 4555, if sellers gain traction. The chart is extremely congested near the 4578-4586 region.
Upside trades on Nasdaq futures – Favorable setups sit on the positive retest of 4606.5, or a positive retest of 4594.75 with positive momentum. I use the 30min to 1hr chart for the breach and retest mechanic. Watch for the lower high to develop near 4604.75, if sellers exercise more power intraday. Targets from 4594.75 are 4597.5, 4602.5, 4606.5, 4608.5, 4611.25, 4618.5, 4625.25, and 4628.25 to 4630, if buyers continue the rally north. Price is likely to collapse at these high levels, so be careful, and if you like trading the edges, a countertrend short could open up here, just at it did yesterday with my peak target at 4618.25.
Downside trades on Nasdaq futures – Favorable setups sit below the failed retest of 4592, or at the failed retest of 4610.75 with negative divergence. Watch those moving averages and trend lines when taking the shorts. Retracement into lower levels from 4592 gives us the targets 4589.75, 4585.5, 4580.75, 4576.75, 4574.75, 4571.5, 4568.25, 4566.5, 4563.75, 4561.75, 4557, 4552.5, 4546.5, 4542.75, 4540, 4538.25, and 4532 to 4528.75, if sellers resume control.
Crude Oil
Volume continues to build near the 45.8 region as we have tested this area for nine sequential days. Buyers are now crowding near 45.55 – bouncing there for the last four days. Above 46.2, we’ve bounced into 46.80, and we head into the API report at the close. For the last two Tuesdays, traders have bought into the news, and sold off afterwards, and with all the snippets out there about oversupply, it seems likely that we have another build on the horizon there. If, however, we fail the 45.5 region, traders will take a more bearish slant, and that lower level target of 44.16 will come into play once more.
The trading ranges for oil begin today between 45.5 to 46.89. A failed retest of 45.5 sends us into 45.04, and potentially much lower. A breach of 46.9 could push us right up into 47.78.
Upside trades on crude oil can be staged on the positive retest of 46.08, or at a bounce off 45.6 with positive momentum. I often use the 30min to 1hr chart for the breach and retest mechanic. Targets from 45.6 are 45.78, 45.88, 46.03, 46.23, 46.48, 46.68, 46.82, 47.04, 47.32, 47.56, 47.78, and 48.14; if traders try once again to recapture 48.
Downside trades on crude oil can be staged on the failed retest of 45.52, or at the failed retest of 46.43 with negative divergence. Targets from 46.43 are 46.3, 46.14, 46.06, 45.93, 45.69, 45.49, 45.26, 45.15, 44.96, 44.67, 44.48, 44.29, 44.16, 44.02, 43.84, and 43.65, if selling really takes hold.
If you’re interested in watching these trades go live, join us in the live trading room from 9am to 11:30am each trading day. It is now primarily stock market futures trading content, though we do track heavily traded stocks and their likely daily trajectories as well – we begin at 9am with a morning report and likely chart movements along with trade setups for the day. Visit TheTradingBook.com for more information.
As long as the trader keeps himself aware of support and resistance levels, risk can be very adequately managed to play in either direction as bottom picking remains a behavior pattern that is developing with value buyers and speculative traders.
Twitter: @AnneMarieTrades
The author trades stock market futures every day and may have a position in mentioned securities at the time of publication. Any opinions expressed herein are solely those of the author, and do not in any way represent the views or opinions of any other person or entity.


