S&P 500 Futures Trading Chart Analysis – July 16
The big banks began reporting this morning and traders are responding quietly positive.
Markets were extremely quiet until the reporting began with very little pullback.
Divergence is present on a few time frames. This means caution with size and extra care if we break support from yesterday as more downside could come into deeper support.
Gold sits above its range resistance at 1412 and continues to hold higher as the markets hold higher and bitcoin and cryptos continue to fade – reversing the upward motion.
Cryptos are filling the gaps from its most recent upside move. The dollar has bounced off support and shows a small inverted head and shoulders pattern that could sent it back to the 98 level.
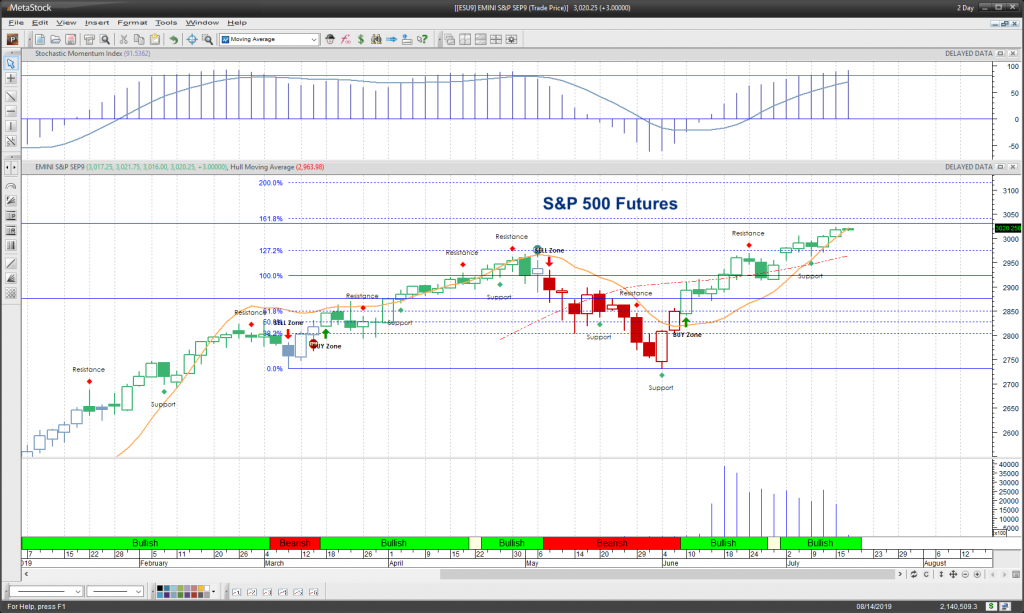
THE BIG PICTURE – Daily momentum is positive but with some divergence. The break of new support areas near 3014 will be very important.
INTRADAY RECAP – Neutral to positive as traders move in to test resistance above after bouncing off support below. Watching the support levels near 3014 and 3006 in the ES_F are on my radar today. Pullbacks will be buy zone but failure to recover above 3017 (if the chart fades at all), we’ll likely be much more vulnerable to further fades.
NEUTRAL TO POSITIVE SLANT – CROSS CURRENTS PRESENT -BOUNCE ACTION TODAY VERY IMPORTANT- USE DIPS TO ENGAGE BUT TOO MANY TESTS OF SUPPORT WILL MAKE THIS TRADE MUCH MORE DANGEROUS. SHORT-TERM TRADERS SHOULD USE STOPS.
CHART FROM METASTOCK USING MY CUSTOM STRATEGY
Twitter: @AnneMarieTrades
The author trades stock market futures every day and may have a position in mentioned securities at the time of publication. Any opinions expressed herein are solely those of the author, and do not in any way represent the views or opinions of any other person or entity.

 Flirting With Critical Support… Again")


