Stock Market Futures Outlook for January 11, 2017 – Range bound behavior continues for stock market futures (and S&P 500 futures) into the news conference scheduled today.
Our levels for expansion and contraction remain the same as yesterday. Buying pressure will likely strengthen above a positive retest of 2271.50. And selling pressure will strengthen with a failed retest of 2259.
Price resistance for S&P 500 futures sits near 2274.75 to 2277.25, with 2280.75 and 2282.5 above that. Price support for S&P 500 futures holds between 2254- 2251, with 2246.50 and 2241.50 below that. See today’s economic calendar with a rundown of releases.
TODAY’S RANGE OF MOTION
E-mini S&P 500 Futures Trading Chart For January 11
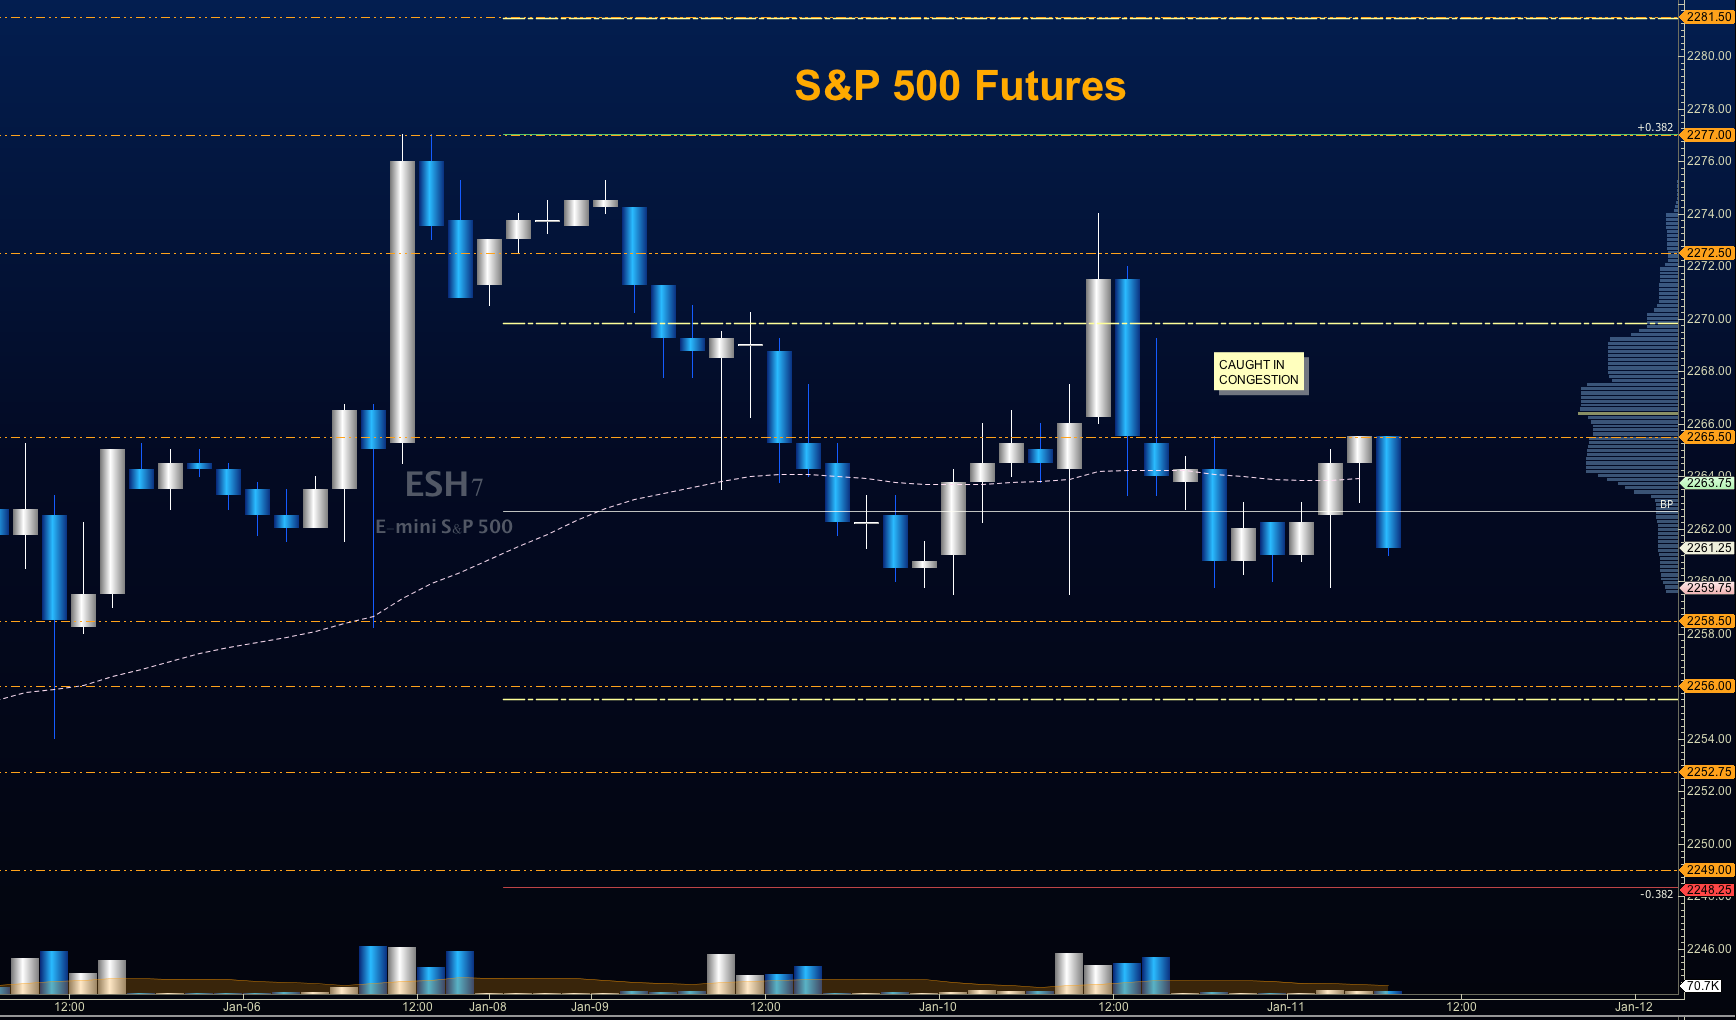
Upside trades – Two options for entry
Positive retest of continuation level -2266.5 (watch for 2270-2271.5 for possible resistance)
Positive retest of support level– 2260.5
Opening targets ranges -2264.5, 2268.5, 2271.25, 2273.5, 2275.75, 2277, 2280.25, 2282.50, and 2285.25
Downside trades – Two options for entry
Failed retest of resistance level -2270.50 (watch for higher support building)
Failed retest of support level– 2262.25 (Watch for 2260.50-2261.50 to potentially provide buying pressure)
Opening target ranges –2268.50, 2265.75, 2260, 2258.75, 2255.75, 2252.75, 2249.75, 2246.50, 2242.75, and 2239.
Nasdaq Futures
The NQ_F gave us another higher high and higher low as money keeps moving into the Nasdaq. This morning marks the first morning, however, that has not printed higher highs in a few days. Momentum is still positive, but we may retest yesterday’s lows if the chart loses 5025.25 and fails to recapture it in the short term.
Buying pressure will likely strengthen with a positive retest of 5038.25 -chart remains very extended. And selling pressure will strengthen with a failed retest of 5017, though short trades are still countertrend today.
Price resistance sits near 5038.25 to 5041, with 5045.5 and 5050.75 above that. Price support holds between 5015 and 5010.75, with 5004.75 and 5002 below that.
Upside trades – Two options
Positive retest of continuation level -5038.25 (needs confirmation on tight time frame)
Positive retest of support level– 5025.25
Opening target ranges –5031.25, 5034.75, 5038, 5045.25, 5050.75 and 5054
Downside trades- Two options
Failed retest of resistance level -5023
Failed retest of support level– 5017 (watch for buyers near 5014 and 5010.5)
Opening target ranges –5021.50, 5017.25, 5012.75, 5010.25, 5007.50, 5004.75, 4997.75, 4994.75, 4991.50, 4985.50, and 4978.75
Crude Oil –WTI
Stopping shy of the final target at 50.35, the WTI contract in crude still sits struggling to rise off 50.80. Selling pressure remains quite apparent. The EIA report is released today, and if the report bodes poorly, there is an auction vacuum all the way down to 50.
Buying pressure will likely strengthen with a positive retest of 52.5, however, in the current formation, it is likely to bump into resistance ahead. Selling pressure will strengthen with a failed retest of 50.78-watch for a group of buyers near 50.4 and 50.04.
Price resistance sits near 52.8 to 53.46, with 53.78 and 54.28 above that. Price support holds between 50.74 and 50.57, with 50.35 and 50.08 below that.
Upside trades – Two options
Positive retest of continuation level -51.59(needs confirmation with positive retest)
Positive retest of support level– 50.8 (watch 51.38 for trouble)
Opening target ranges –51.22, 51.38, 51.55, 51.75, 52.02, 52.09, 52.39, 52.6, 52.78, 53.03, 53.23, 53.46, 53.82, 54.12, 54.28, 54.51, 54.76, 55.06, and 55.24
Downside trades- Two options
Failed retest of resistance level -51.38 (watch for higher lows to stop flow down – key support point in the chart here)
Failed retest of support level– 50.78 (watch support near 50.47 -50.35 if a breach up intends to break the cycle)
Opening target ranges –51.2, 51.02, 50.84, 50.47, 50.34, and 50.16
If you’re interested in the live trading room, it is now primarily stock market futures content, though we do track heavily traded stocks and their likely daily trajectories as well – we begin at 9am with a morning report and likely chart movements along with trade setups for the day.
As long as the trader keeps himself aware of support and resistance levels, risk can be very adequately managed to play in either direction as bottom picking remains a behavior pattern that is developing with value buyers and speculative traders.
Twitter: @AnneMarieTrades
The author trades stock market futures every day and may have a position in mentioned securities at the time of publication. Any opinions expressed herein are solely those of the author, and do not in any way represent the views or opinions of any other person or entity.

: Showing Some Signs of Emerging Strength")

