Stock Market Futures Trading Considerations For September 11, 2017
The S&P 500 (INDEXSP:.INX) and the broad stock market futures indices are rallying higher this morning. Key trading levels for today are listed below.
Check out today’s economic calendar with a full rundown of releases. And note that the charts below are from our premium service and shared exclusively with See It Market readers.
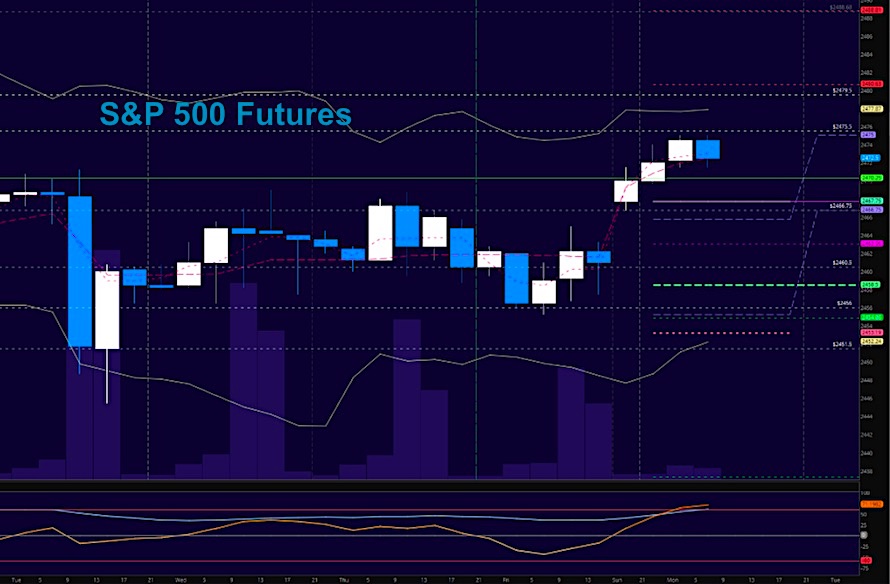
S&P 500 Futures (ES)
Big bounce into the gap created in the beginning of September. Gaps like this into areas of low volume are likely to fail. Chart at the top of near term resistance and fading but likely into higher lows as momentum is bullish. The bullets below represent the likely shift of trading momentum at the positive or failed retests at the levels noted.
- Buying pressure intraday will likely strengthen above a positive retest of 2470.25 ( a pullback off these current highs)
- Selling pressure intraday will likely strengthen with a failed retest of 2466 (to fill the gap)
- Resistance sits near 2475 to 2478.5, with 2480.5 and 2486.5 above that
- Support holds between 2466.5 and 2462.75, with 2456.5 and 2451.5 below that
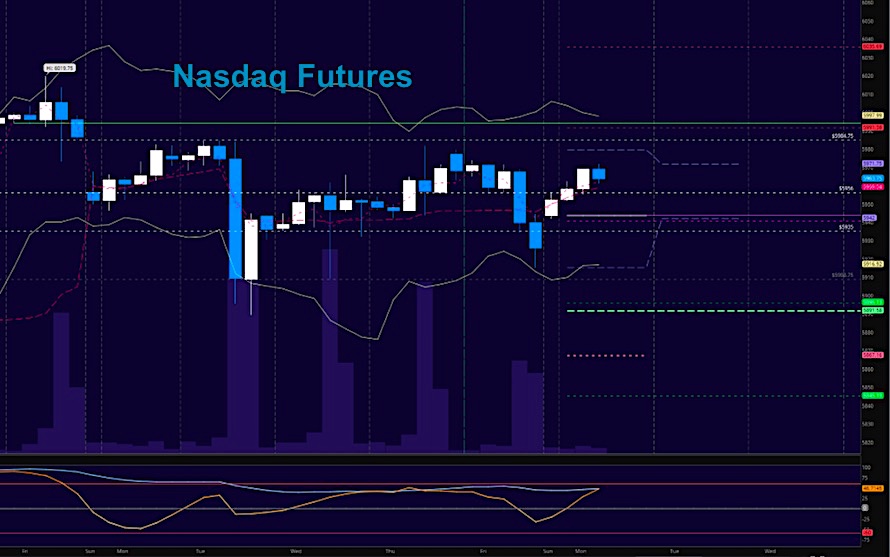
NASDAQ Futures (NQ)
Momentum continues mixed with lower highs still present. Range bound behavior between 5930.5 and 5980 – even though we did test the lower support, buyers did come to the rescue. The bullets below represent the likely shift of intraday trading momentum at the positive or failed tests at the levels noted.
- Buying pressure intraday will likely strengthen with a positive retest of 5980
- Selling pressure intraday will likely strengthen with a failed retest of 5934
- Resistance sits near 5974.5 to 5980, with 5984.25 and 5997.5 above that
- Support holds between 5942.25 and 5934.5, with 5916 and 5891.5 below that
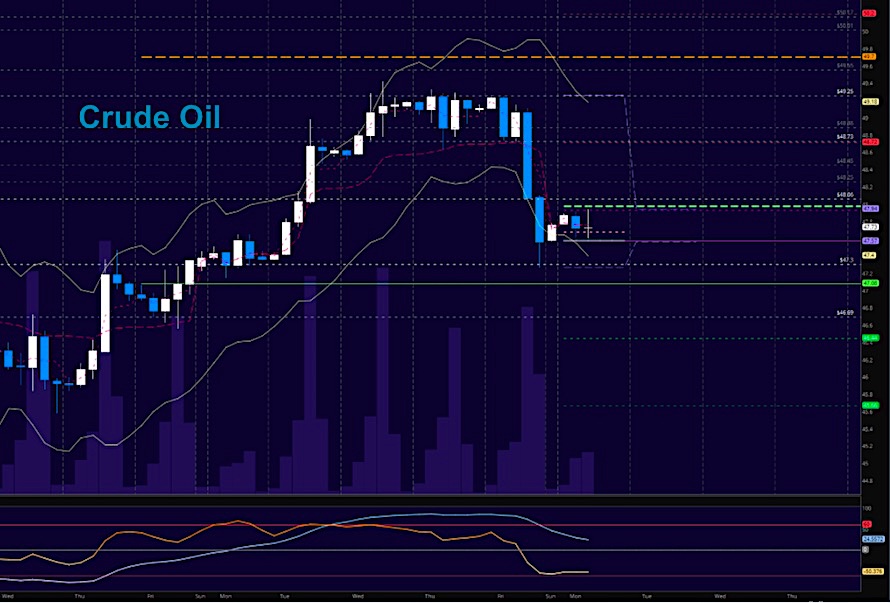
WTI Crude Oil
Third day in a tighter range – so watch for the breaks below and above the range for signals of continuation. Resistance sits at 49.43 and 49.82. We sit above well above resistance at this time and momentum is mixed. Buyers will have the upper hand as long as we hold 48.4. The bullets below represent the likely shift of trading momentum at the positive or failed tests at the levels noted.
- Buying pressure intraday will likely strengthen with a positive retest of 49.45
- Selling pressure intraday will strengthen with a failed retest of 48.4
- Resistance sits near 49.39 to 49.63, with 49.71 and 49.99 above that
- Support holds between 48.92 to 48.5, with 48.15 and 47.5 below that
If you’re interested in watching these trades go live, join us in the live trading room from 9am to 11:30am each trading day. Visit TheTradingBook for more information.
If you’re interested in the live trading room, it is now primarily stock market futures content, though we do track heavily traded stocks and their likely daily trajectories as well – we begin at 9am with a morning report and likely chart movements along with trade setups for the day.
As long as the trader keeps himself aware of support and resistance levels, risk can be very adequately managed to play in either direction as bottom picking remains a behavior pattern that is developing with value buyers and speculative traders.
Twitter: @AnneMarieTrades
The author trades stock market futures every day and may have a position in mentioned securities at the time of publication. Any opinions expressed herein are solely those of the author, and do not in any way represent the views or opinions of any other person or entity.
 Rolling Over At Key Fibonacci Level?")


 Rolling Over At Key Fibonacci Level?")


