Stock Market Outlook for November 3, 2016 –
Bounces on the S&P 500 Index (INDEXSP:.INX) were weak yesterday and an overnight dip into 2084 was, indeed, very bearish. However, a closer look at the chart shows us very near price support levels that bullish traders will attempt to hold. For now, the negative momentum will show itself with bounces being sold. The key price area to recapture on S&P 500 futures this morning is 2102. Above there, buyers will become bold about advancing the price. Tight congestion patterns still hold between 2123 and 2137. Price support though briefly broken still holds in the regions near 2090-2085. A break below there today forces us to consider 2074-2077 as the targets below.
See today’s economic calendar with a rundown of releases.
TODAY’S RANGE OF MOTION
S&P 500 Futures Trading Outlook Chart – November 3
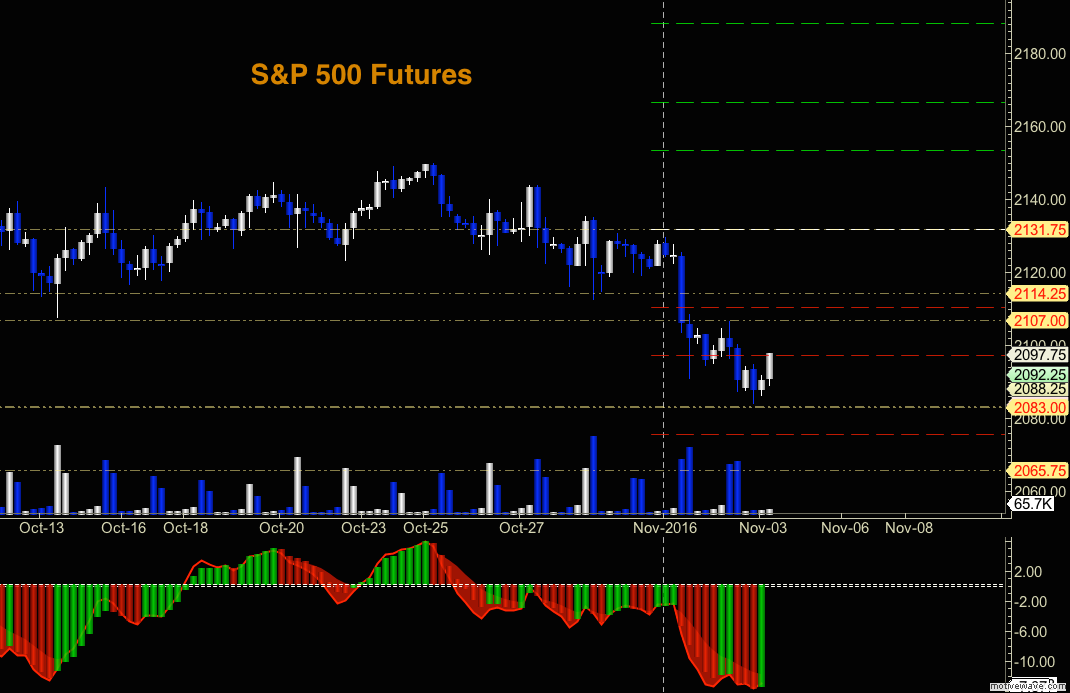
Upside trades on S&P 500 futures – Favorable setups sit on the positive retest of 2102.5, or a positive retest of the bounce off 2087.5 with upward momentum. I use the 30min to 1hr chart for the breach and retest mechanic. Targets from 2087.50 are 2091.5, 2097.25, 2102.5, 2106.5, 2110.25, 2112.25, 2119.5, 2126.5, 2130.75, 2136.5, and 2140.5.
Downside trades on S&P 500 futures – Favorable setups sit below the failed retest of 2085, or at the failed retest of 2101.75 (watch for the higher low if this is attempted) with negative divergence. Retracements into lower levels from 2101.75 give us the targets of 2100.25, 2094.75, 2091.5, 2088.5, 2085.75, 2077.75, and perhaps 2075.75, if charts cascade again.
Nasdaq Futures
The NQ_F continued the deep fade as it marches to test lower support levels. As long as we are below 4770, the pressure to sell will remain. Support sits in the region between 4704 and 4664. Bounces will be sold in the current formation.
Upside trades on Nasdaq futures – Favorable setups sit on the positive retest of 4718.75, or a positive retest of 4701.5 with positive momentum. I use the 30min to 1hr chart for the breach and retest mechanic. Targets from 4701.5 are 4707, 4714.75, 4724, 4731.75, 4740.5, 4747.75, 4753.25, 4756, 4762.25, 4770, 4774.5 and 4778.
Downside trades on Nasdaq futures – Favorable setups sit below the failed retest of 4701 (needs negative momentum here for continuation), or at the failed retest of 4714 with negative divergence. Retracements into lower levels from 4714 are 4704, 4701.25, 4689.5, 4686.5, and 4667.25, should selling continue.
Crude Oil
EIA reported the largest build in 20 years yesterday leading traders to break a key support level near 45.89. The support level below at 45 was also broken, but held into a bounce test of resistance at 45.9 – typical example of old support becoming new resistance. There is another day of choppy trading ahead. The chart still holds negative momentum for now.
Trading ranges for crude oil futures for the week have expanded on the lower end again- 44.04 to 48.4 in the current pattern….though that upper edge seems quite far away right now.
Upside trades on crude oil can be staged on the positive retest of 45.9, or at a positive retest off 45.4 with positive momentum. I often use the 30min to 1hr chart for the breach and retest mechanic. Targets from 45.4 are 45.84, 46.06, 46.29, 46.55, 46.8, 47.24, 47.54, and 47.72.
Downside trades on crude oil can be staged on the failed retest of 45.3, or at the failed retest of 45.9 with negative divergence. Targets from 45.9 are 45.45, 45.04, 44.72, and 44.23.
If you’re interested in the live trading room, it is now primarily stock market futures content, though we do track heavily traded stocks and their likely daily trajectories as well – we begin at 9am with a morning report and likely chart movements along with trade setups for the day.
As long as the trader keeps himself aware of support and resistance levels, risk can be very adequately managed to play in either direction as bottom picking remains a behavior pattern that is developing with value buyers and speculative traders.
Twitter: @AnneMarieTrades
The author trades stock market futures every day and may have a position in mentioned securities at the time of publication. Any opinions expressed herein are solely those of the author, and do not in any way represent the views or opinions of any other person or entity.


