S&P 500 Futures July 18 – Trading Outlook
Today’s price action looks much like Friday’s. S&P 500 futures are trapped between price support near 2153 and price resistance near 2163. The financial markets are essentially quiet after the failed Turkey coup, one of many recent news events. Breaches in either direction could expand as technical divergence continues beneath the price action. This has been the case for stock market futures and the S&P 500 Index (INDEXSP:.INX) for days. The moving averages continue to flatten, but still hold price on several time frames. Support to watch below 2151 would be 2146 and 2140.5. Resistance above 2163 sits near 2167.75 to 2178.75. I suspect the day will be range bound, but failed retests at the levels noted above will create drift in the direction of the break.
See today’s economic calendar with a rundown of releases.
RANGE OF TODAY’S MOTION
S&P 500 Futures July 18 – Trading Chart (ES_F)
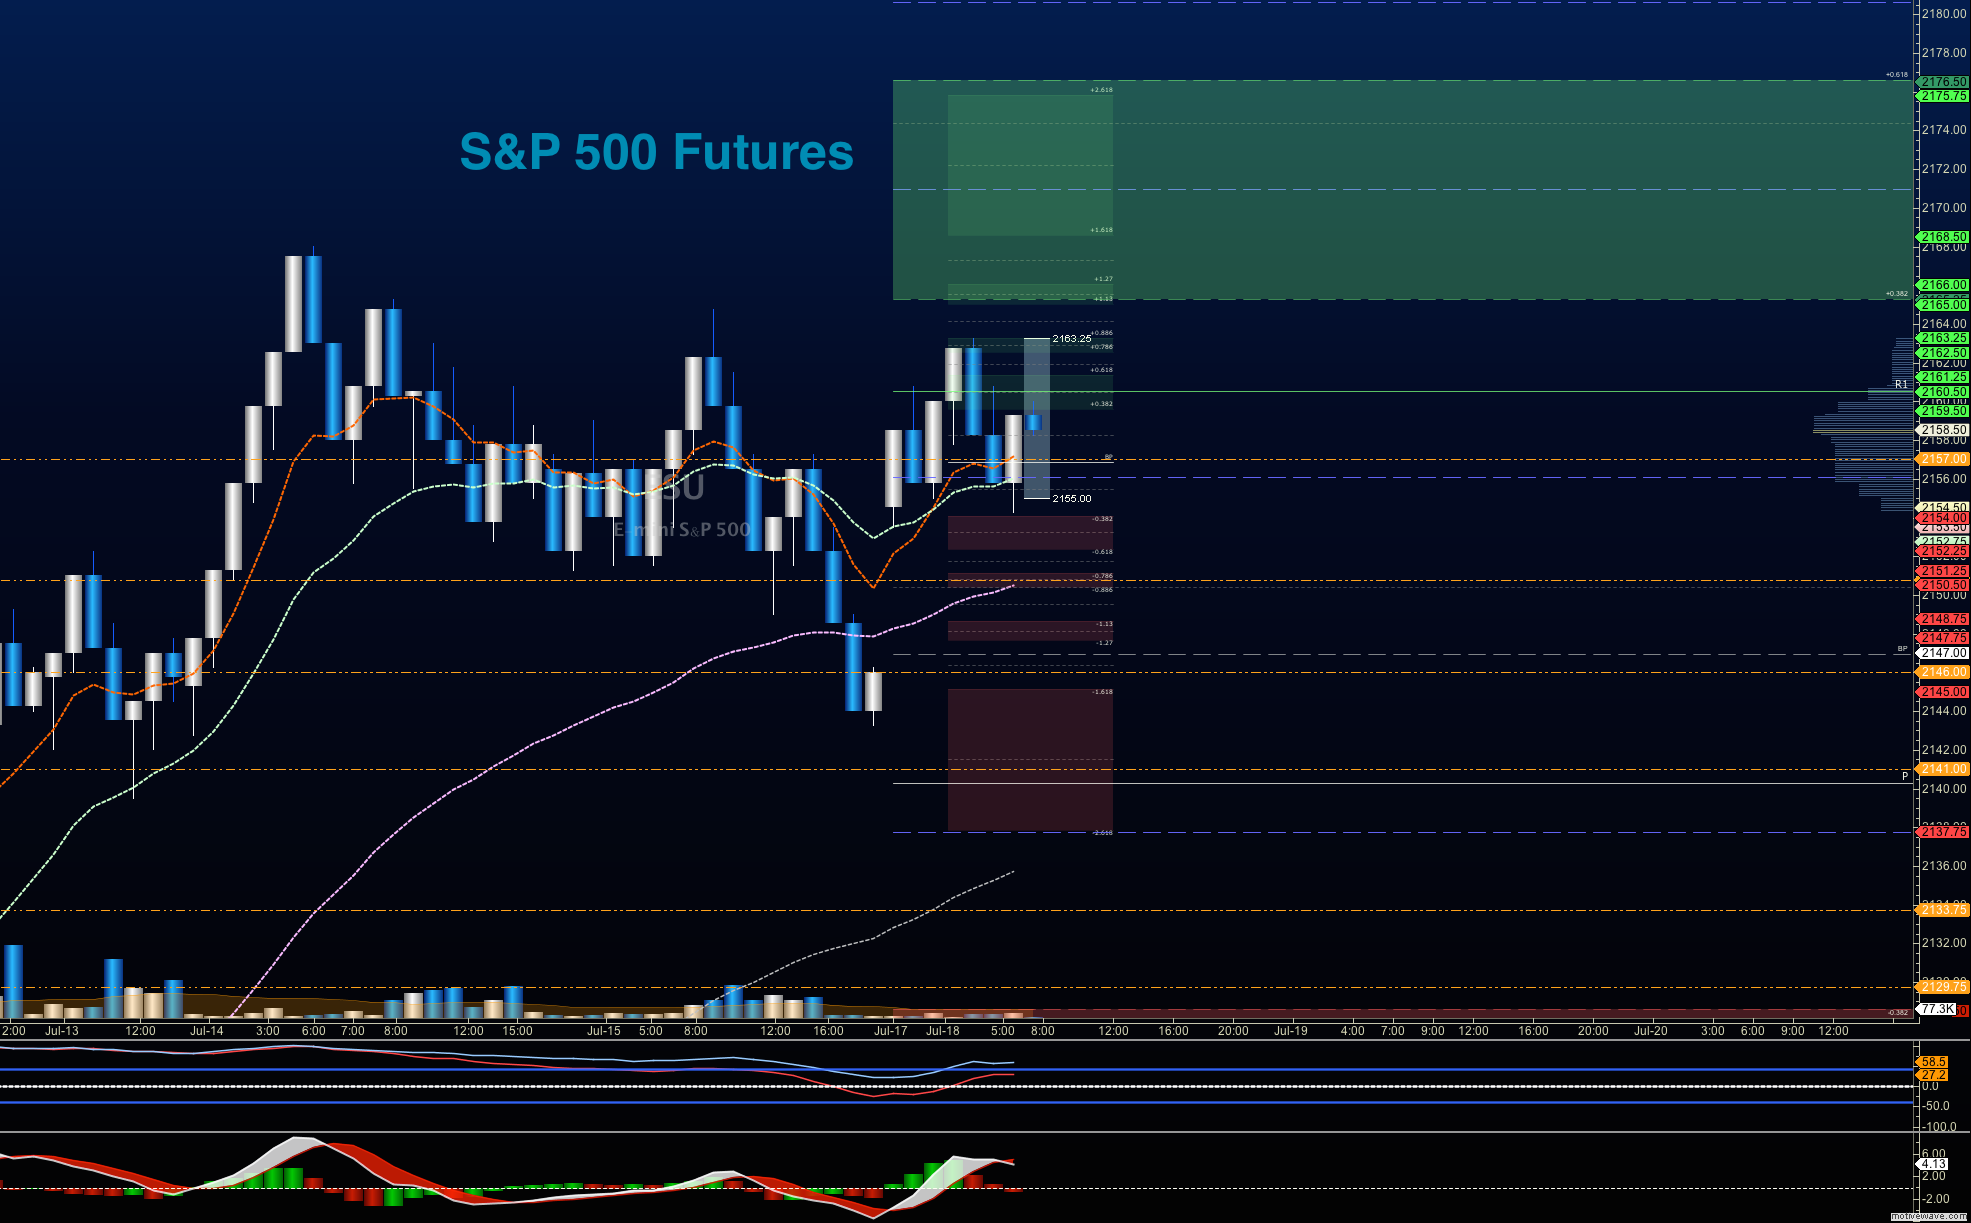
Upside trades on S&P 500 futures – Favorable setups sit on the positive retest of 2161.5, or a positive retest of the bounce off 2153.5 with positive momentum. Keep an eye out for lower highs to set in, as this could signal that sellers are collecting strength. I use the 30min to 1hr chart for the breach and retest mechanic. Price targets from 2153.5 are 2157.5, 2161.5, 2163.25, 2167.5, 2171.5, 2175.75, and if we expand, we are likely to stretch above into 2179.75.
Downside trades on S&P 500 futures – Favorable setups sit below the failed retest of 2151 or at the first failed retest of 2160.5 with negative divergence. As this is a countertrend trade, make sure that you keep your eyes on the lookout for higher lows developing intraday. Retracement into lower levels from 2160.5 gives us the targets 2157.75, 2155.5, 2151.25, 2147.75, 2145.75, 2143, 2141.75, 2138.75, 2136.5, 2134.5, 2128.25, 2124.5, 2122.75, and 2120.75 to 2118.5, if sellers take over.
Have a look at the Fibonacci levels marked in the blog for more targets.
Nasdaq Futures
The NQ_F continues range bound activity with resistance above near 4598.75 to 4618.25, and support near 4570, with a lower break into 4555, if sellers gain traction. The chart is extremely congested near the 4578-4586 region.
Upside trades on Nasdaq futures – Favorable setups sit on the positive retest of 4595.25, or a positive retest of 4576.75 with positive momentum. I use the 30min to 1hr chart for the breach and retest mechanic. Watch for the lower high to develop near 4598.75, if sellers exercise more power intraday. Targets from 4576.75 are 4582.5, 4585.5, 4589.25, 4592.25, 4595.5, 4598.5, 4602.5, 4606.75, 4608.5, and 4611.75 to 4618.25, if buyers overpower sellers sitting near 4606.
Downside trades on Nasdaq futures – Favorable setups sit below the failed retest of 4579.25, or at the failed retest of 4592.25 with negative divergence. Watch those moving averages and trend lines when taking the shorts. Retracement into lower levels from 4592.25 gives us the targets 4589.75, 4585.5, 4582.75, 4579.75, 4574.5, 4571.5, 4568.25, 4566.5, 4563.75, 4561.5, 4557, 4552.5, 4546.5, 4542.75, 4540, 4538.25, and 4532 to 4528.75, if sellers resume control.
Crude Oil
As I suspected on Friday (see post for Friday), we saw a price resolution move out of the congested area for crude oil. However, we now sit in a wait state below another resistance level near 46.8.
The trading range on crude oil begins today between 46.08 to 46.89, but negative momentum may push us back to a test of the 45.6 area. When charts are mixed, we should expect range bound behavior, but sellers seem to be active in the space as news of higher rig counts and expanded production levels hold the headlines. A breach of 46.9 could push us right up into 47.78.
Upside trades on crude oil can be staged on the positive retest of 46.84, or at a bounce off 46.34 with positive momentum. I often use the 30min to 1hr chart for the breach and retest mechanic. Targets from 46.34 are 46.48, 46.6, 46.9, 47.04, 47.32, 47.56, 47.78, and 48.14; if traders try once again to recapture 48.
Downside trades on crude oil can be staged on the failed retest of 46.2, or at the failed retest of 46.6 with negative divergence. Targets from 46.6 are 46.36, 46.24, 46.06, 45.86, 45.62, 45.49, 45.26, 45.15, 44.96, 44.67, 44.48, 44.29, 44.16, 44.02, 43.84, and 43.65, if selling really takes hold.
Visit TheTradingBook.com for more information.
If you’re interested in the live trading room, it is now primarily stock market futures content, though we do track heavily traded stocks and their likely daily trajectories as well – we begin at 9am with a morning report and likely chart movements along with trade setups for the day.
As long as the trader keeps himself aware of support and resistance levels, risk can be very adequately managed to play in either direction as bottom picking remains a behavior pattern that is developing with value buyers and speculative traders.
Twitter: @AnneMarieTrades
The author trades stock market futures every day and may have a position in mentioned securities at the time of publication. Any opinions expressed herein are solely those of the author, and do not in any way represent the views or opinions of any other person or entity.


 Ready To Break Out?")
