Stock Market Futures Trading Considerations For July 14
Stocks continue to float higher as the S&P 500 (INDEXSP:.INX) eyes new all-time highs. For now, the June highs will serve as resistance. See key futures trading levels for the S&P 500, Nasdaq, and crude oil below.
Check out today’s economic calendar with a full rundown of releases. And note that the charts below are from our premium service and shared exclusively with See It Market readers.
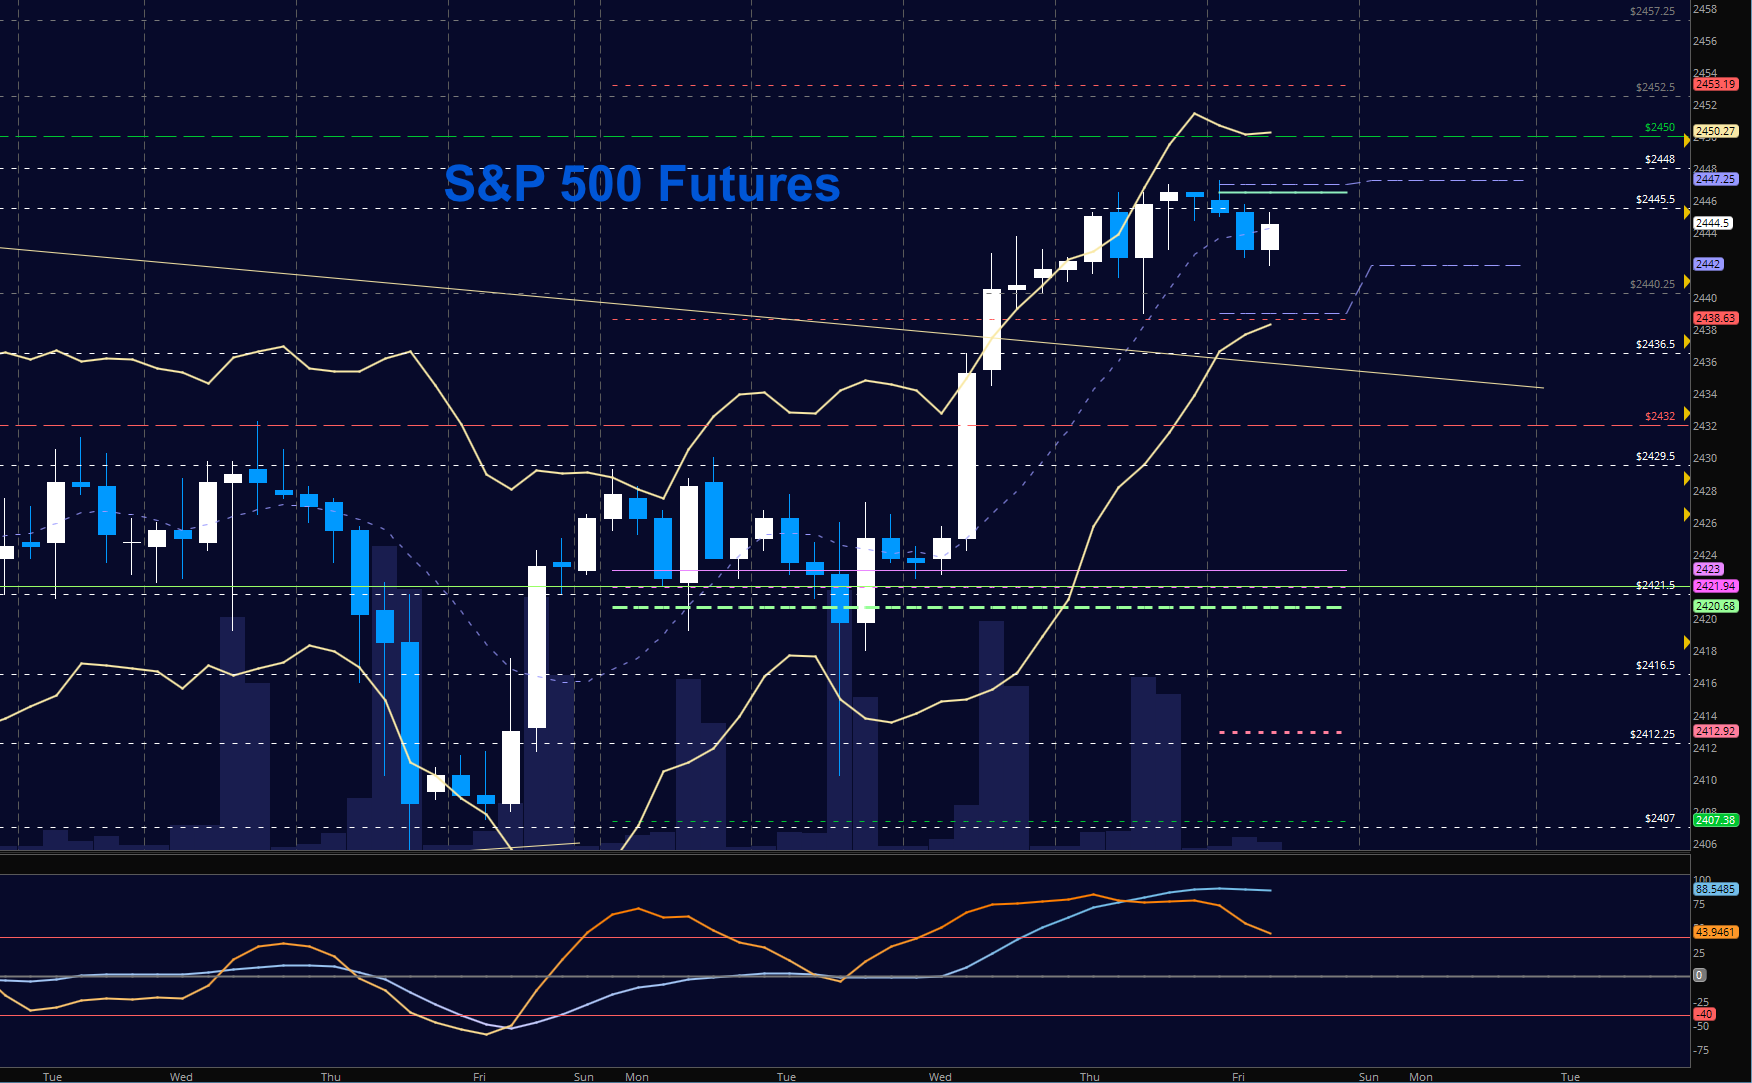
S&P 500 Futures (ES)
Charts have stalled here at 2445.5 as buyers and sellers battle for the winning side in the earlier morning as support rises to near 2440. Momentum still suggests that pullbacks will find buyers, but breakouts will be tougher to hold. The bullets below represent the likely shift of trading momentum at the positive or failed retests at the levels noted.
- Buying pressure intradaywill likely strengthen above a positive retest of 2446.5 (careful again here with resistance)
- Sellingpressure intraday will likely strengthen with a failed retest of 2439
- Resistance sits near 2445.5 to 2448.5, with 2451.5 and 2454.5 above that.
- Support holds between 2439.5 and 2435.25, with 2431.25 and 2429.5 below that.
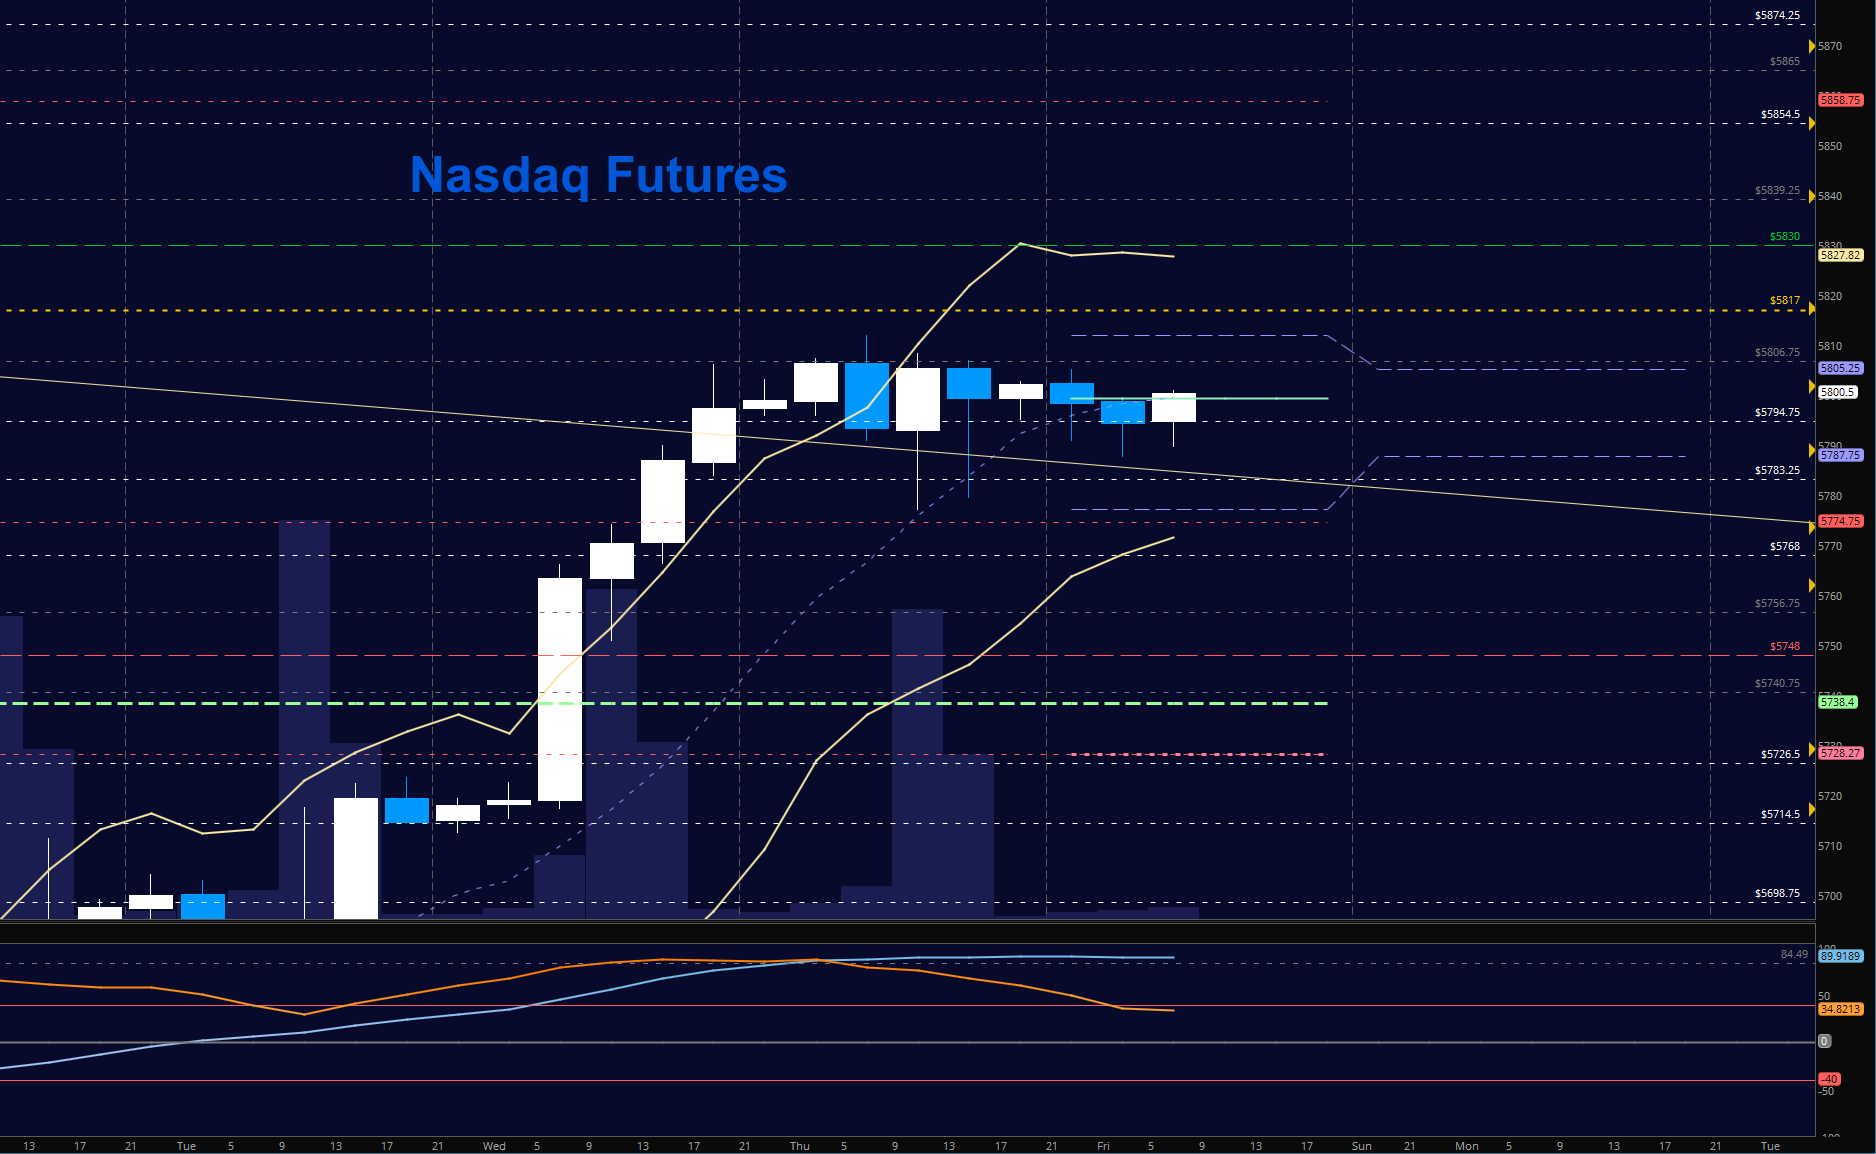
NASDAQ Futures (NQ)
Nasdaq futures here have also stalled and now buyers need to press above 5806.5 to hold and move forward, else we are set to fade or move sideways. Resistance above this region can stretch us 30 points into 5834 to 5839, and support holds steady near 5784. The chart is squeezing. The bullets below represent the likely shift of intraday trading momentum at the positive or failed tests at the levels noted.
- Buyingpressure intraday will likely strengthen with a positive retest of 5806.5
- Sellingpressure intraday will likely strengthen with a failed retest of 5783.5
- Resistance sits near 5806.5 to 5816.75, with 5828.75 and 5839.5 above that.
- Support holds between 5783.5 and 5768.5, with 5756.5 and 5724.5 below that.
WTI Crude Oil
Oil continues to lift under curtailing language and traders holding long positions. Momentum is flat to slightly upward, suggesting that buyers will find support. The bullets below represent the likely shift of trading momentum at the positive or failed tests at the levels noted.
- Buyingpressure intraday will likely strengthen with a positive retest of 46.77(careful -resistance ahead)
- Sellingpressure intraday will strengthen with a failed retest of 45.80
- Resistance sits near 46.54 to 46.82, with 47.09 and 47.31 above that
- Support holds between 45.92 to 45.67, with 45.45 and 44.94 below that.

If you’re interested in watching these trades go live, join us in the live trading room from 9am to 11:30am each trading day. Visit TheTradingBook for more information.
If you’re interested in the live trading room, it is now primarily stock market futures content, though we do track heavily traded stocks and their likely daily trajectories as well – we begin at 9am with a morning report and likely chart movements along with trade setups for the day.
As long as the trader keeps himself aware of support and resistance levels, risk can be very adequately managed to play in either direction as bottom picking remains a behavior pattern that is developing with value buyers and speculative traders.
Twitter: @AnneMarieTrades
The author trades stock market futures every day and may have a position in mentioned securities at the time of publication. Any opinions expressed herein are solely those of the author, and do not in any way represent the views or opinions of any other person or entity.


