Stock Market Outlook for January 5, 2017 –
The S&P 500 (INDEXSP:.INX) pushed higher yesterday but traders failed to breach and hold a key level. On S&P 500 futures, that level is 2267.75. And after putting in a lower low on 12/30 this suggests that we have sideways to downside action likely today. Market pullbacks are still quite likely to be bought, but lower lows intraday suggest that sellers are attempting to exercise power against the prevailing bullish trend.
Buying pressure will likely strengthen above 2265 on S&P 500 futures. Selling pressure will strengthen with a failed retest of 2257. Resistance sits near 2262.75 to 2267.25 with 2272.75 above that. Support holds between 2254- 2249 with a failed test of 2257.
See today’s economic calendar with a rundown of releases.
TODAY’S RANGE OF MOTION
E-mini S&P 500 Futures Trading Chart For January 5
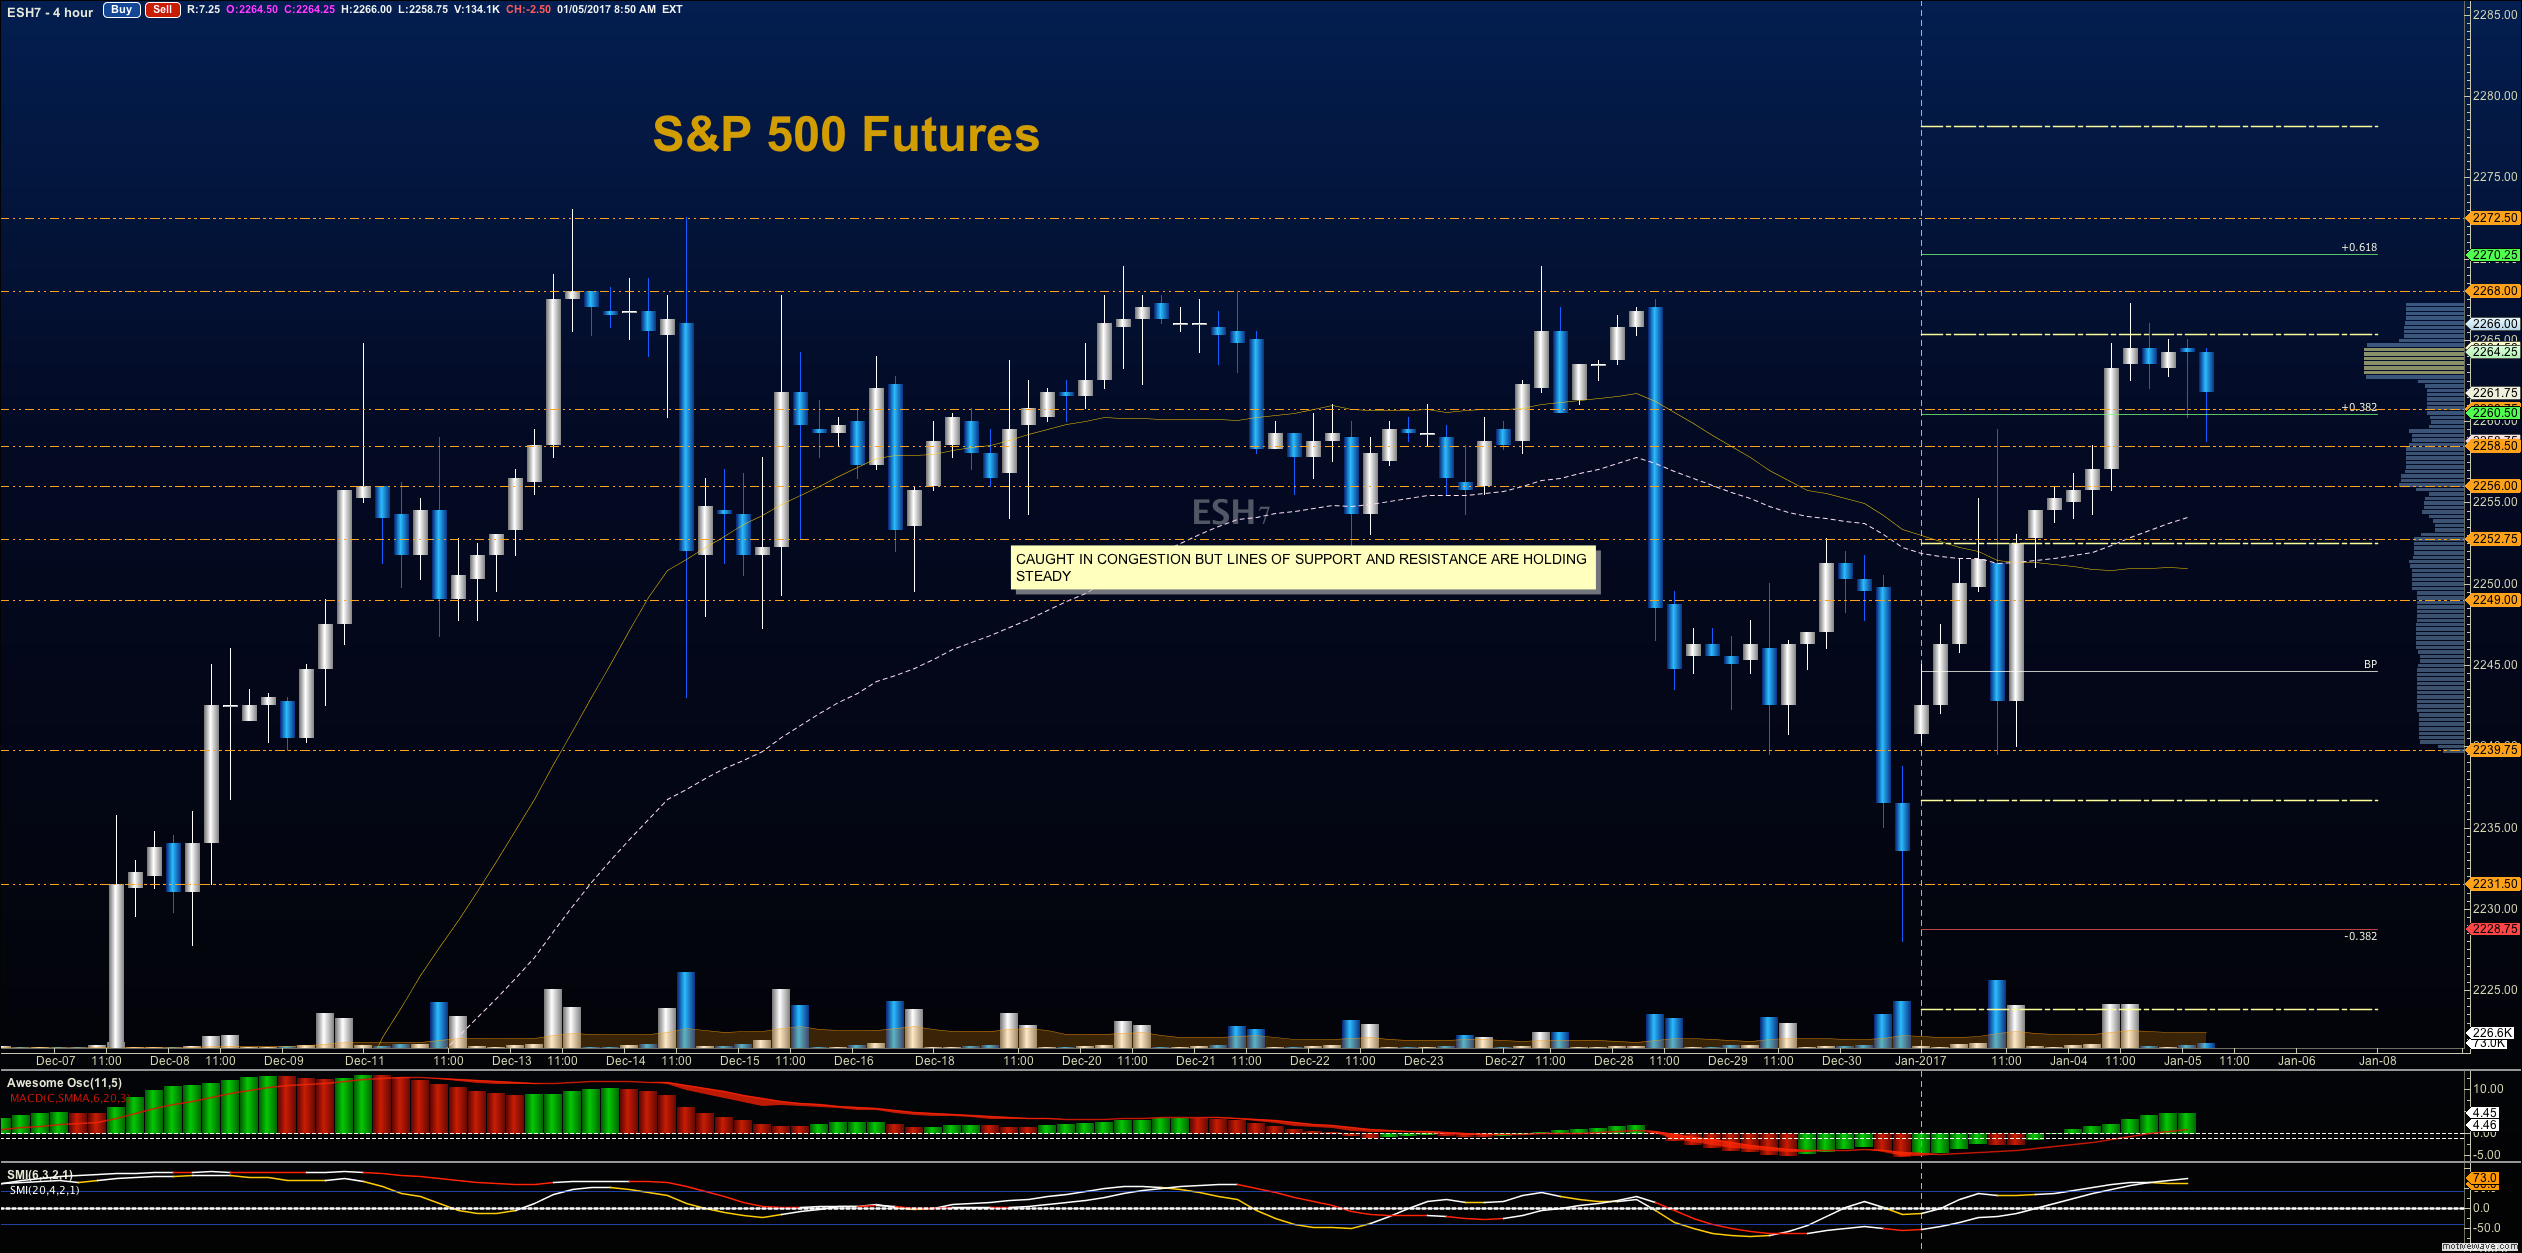
Upside trades – Two options for entry
Positive retest of continuation level – 2265
Positive retest of support level – 2257.25
Opening targets ranges – 2260.75, 2264.25, 2266, 2268.25, 2271.25, 2272.75, 2275.50, 2278.25 and 2282.50
Downside trades – Two options for entry
Failed retest of resistance level – 2262.5
Failed retest of support level – 2256.75
Opening target ranges – 2258.75, 2256.75, 2252.75, 2249.75, 2246.50, 2242.75, 2239, 2235, 2231.50, 2227.75, 2224.25, and 2221.75
Nasdaq Futures
The NQ_F sits in a patch of mixed momentum, but formations still show bullish pressure. This suggests that we may see candlesticks with longer wicks. The primary area of resistance remains the region near 4940-4942. Several contradictory patterns are showing so big bounces should fade and big pullbacks should bounce.
Buying pressure will likely strengthen above a retest of 4935 that holds. Selling pressure will strengthen with a failed retest of 4921. Resistance sits near 4941 to 4952 with 4958 above that. Support holds between 4909- 4917.75 with a failed test of 4921.
Upside trades – Two options
Positive retest of continuation level – 49354 (needs confirmation on tight time frame)
Positive retest of support level – 4919.5 (also needs confirmation)
Opening target ranges –4912.75, 4917.75, 4921.50, 4924.5, 4930.50, 4936.75, 4940.75, 4947.75, 4952.75, 4959, 4962.25, 4966.75, 4973.25, 4978.5, 4988.25, 4994, 4997, and 5002.25
Downside trades- Two options
Failed retest of resistance level – 4927 (watch for congestion or a hold of 4924)
Failed retest of support level – 4921 (watch for support near 4919 and 4917.75)
Opening target ranges – 4942.75, 4921.50, 4919, 4916.50, 4912.25, 4909.50, 4906.25, 4902.25, 4897, 4891.75, 4885.25, 4879.75, 4871.75, 4861.75, 4857.5, and 4851.75,
Crude Oil –WTI
As the oil chart held critical support levels, we did well testing the bottom and holding the bounce. We are still caught in a wide band of motion that is generally bullish. The EIA report is to be released this morning. We have held higher lows and higher highs in the smaller formation, but may be in a flag pattern. With neutral momentum, and news ahead, we’re looking at a coin toss, so best to watch for failed retests to engage in price action unless you are quick on the trigger.
Buying pressure will likely strengthen above a retest of 53.85 that holds. Selling pressure will strengthen with a failed retest of 53.3. Resistance sits near 53.85 to 54.17, with 54.5 above that. Support holds between 52.78 and 53.03 with a failed test of 53.3.
Upside trades – Two options
Positive retest of continuation level -53.85 (needs confirmation)
Positive retest of support level– 53.34
Opening target ranges – 53.66, 53.83, 53.94, 54.07, 54.21, 54.35, 54.51, 54.7, 54.94, 55.24, 55.34, 55.7, 56.05, and 56.5
Downside trades- Two options
Failed retest of resistance level -54.21
Failed retest of support level– 53.3 (watch support near 53.2 if the chart breaks through the high early in the day)
Opening target ranges – 54.04, 53.84, 53.66, 53.4, 53.23, 53.03, 52.78, 52.51, 52.32, 52.12, 51.82, 51.56, 51.3, and 51.12
If you’re interested in the live trading room, it is now primarily stock market futures content, though we do track heavily traded stocks and their likely daily trajectories as well – we begin at 9am with a morning report and likely chart movements along with trade setups for the day.
As long as the trader keeps himself aware of support and resistance levels, risk can be very adequately managed to play in either direction as bottom picking remains a behavior pattern that is developing with value buyers and speculative traders.
Twitter: @AnneMarieTrades
The author trades stock market futures every day and may have a position in mentioned securities at the time of publication. Any opinions expressed herein are solely those of the author, and do not in any way represent the views or opinions of any other person or entity.


: Showing Some Signs of Emerging Strength")
