Stock Market Futures Outlook for January 12, 2017 –
The S&P 500 (INDEXSP:.INX) is landlocked for the seventh day, and though we extend ourselves over the edges for a moment during the day, we are quickly seeing that strength is being sold and weakness in being bought.
This is a pattern that works… until it doesn’t. So use caution and pay attention to price behavior at the edges before committing to the trade with size. Buying pressure will likely strengthen above a positive retest of 2271.50. Selling pressure will strengthen with a failed retest of 2259.
Price resistance sits near 2274.75 to 2277.25, with 2280.75 and 2282.5 above that. Price support holds between 2255- 2251, with 2246.50 and 2241.50 below that. See today’s economic calendar with a rundown of releases.
TODAY’S RANGE OF MOTION
E-mini S&P 500 Futures Trading Chart For January 12
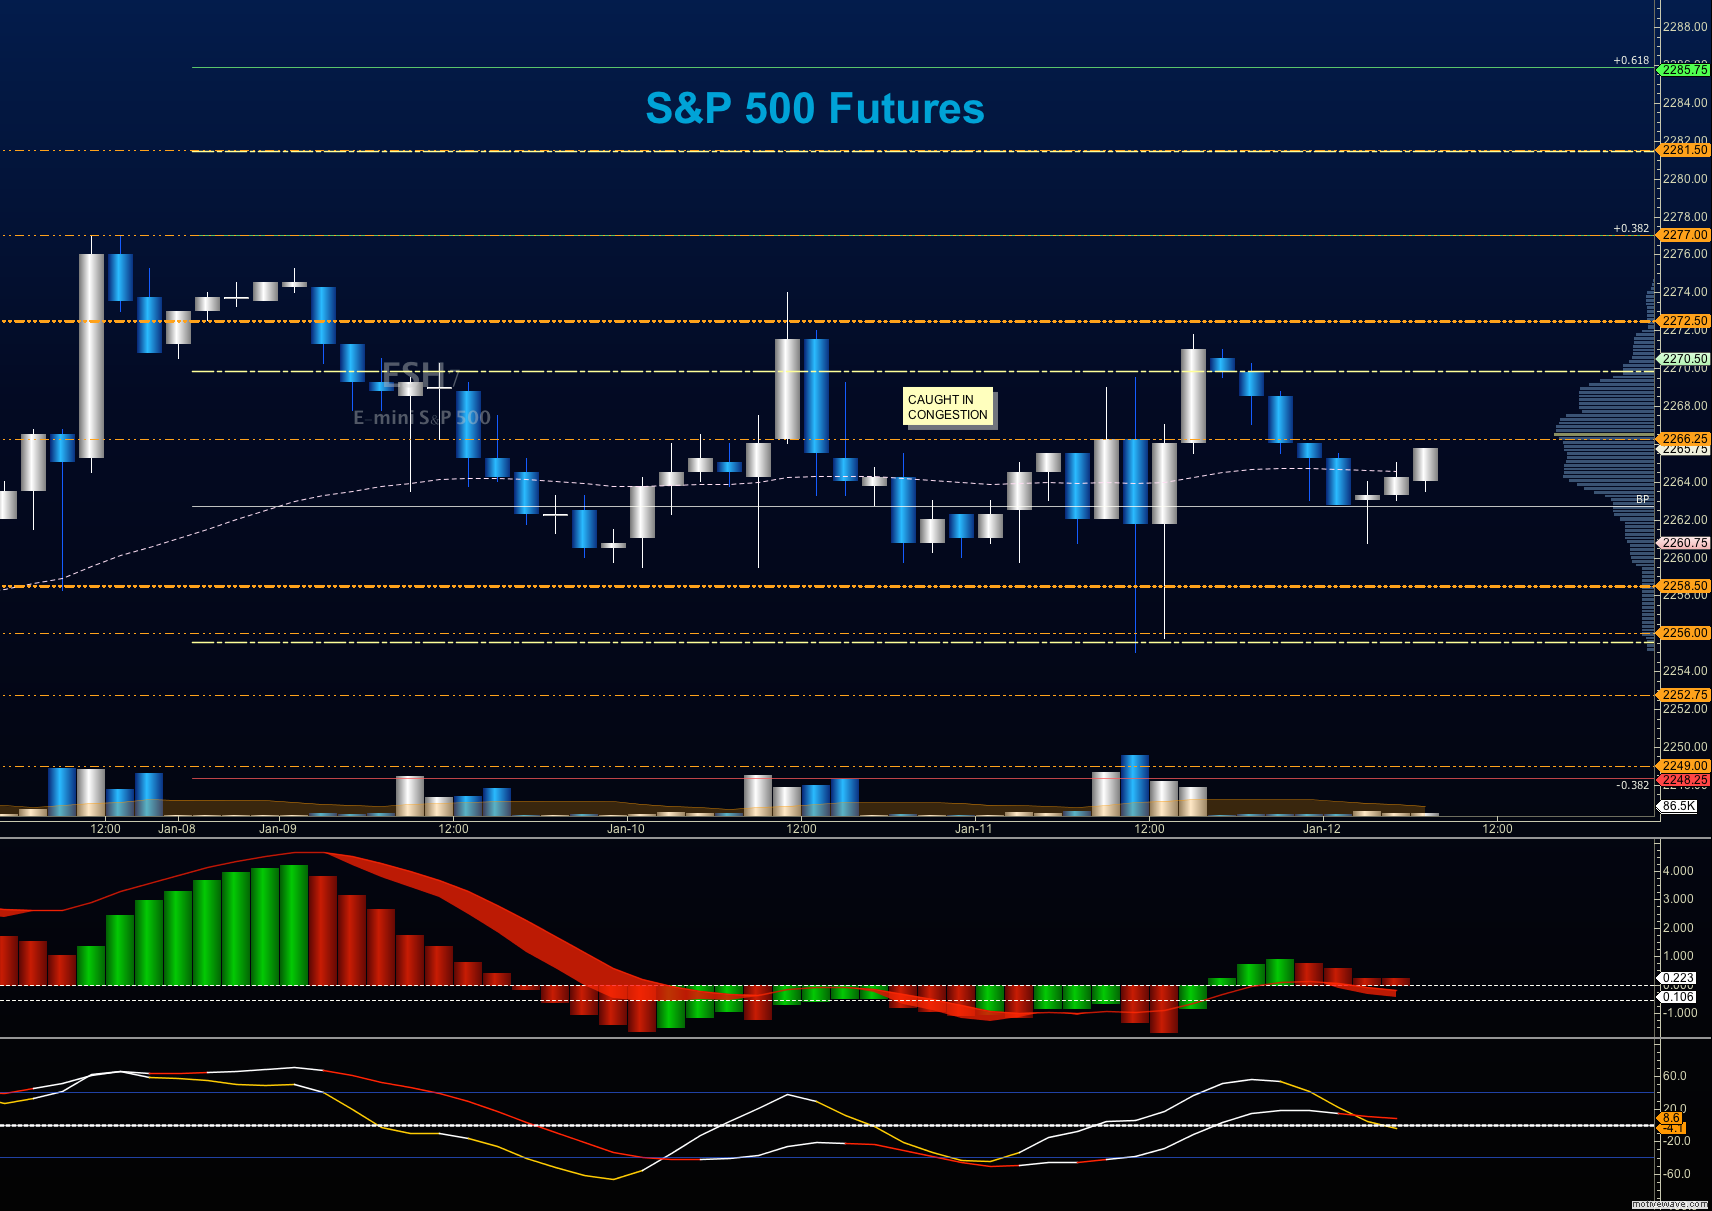
Upside trades – Two options for entry–
Positive retest of continuation level -2266.5 (watch for 2270-2271.5 for possible resistance)
Positive retest of support level– 2261.5
Opening targets ranges – 2264.75, 2268, 2270.25, 2273.75, 2275.75, 2277, 2280.25, 2282.50, and 2285.25
Downside trades – Two options for entry–
Failed retest of resistance level -2270.50 (watch for higher support building- sellers may also arrive at 2268.50)
Failed retest of support level– 2260.50
Opening target ranges –2268.50, 2266.5, 2262.25, 2260.50, 2258.75, 2255.75, 2252.75, 2249.75, 2246.50, 2242.75, and 2239.
Nasdaq Futures
The NQ_F gave us another higher high yesterday. The chart is grinding higher and is presenting higher lows as we speak. As I suspected, however, we drifted right into the low of the prior day with the loss of 5025.25, so today we’ll be watching for that same kind of test. The upward action is definitely beginning to slow but no indication of weakness, outside of minor divergence is showing.
Buying pressure will likely strengthen with a positive retest of 5040.25 -chart remains very extended. Selling pressure will strengthen with a failed retest of 5020, though short trades are still countertrend today.
Price resistance sits near 5041 to 5045, with 5048.5 and 5050.75 above that.
Price support holds between 5025 and 5020.75, with 5010.75 and 5007.5 below that.
Upside trades – Two options
Positive retest of continuation level -5037.25 (needs confirmation on tight time frame and watch for 5040.25 for potential sellers)
Positive retest of support level– 5025.25
Opening target ranges –5031.5, 5035.75, 5038.25, 5044.25, 5048, 5050.75, and 5054
Downside trades- Two options
Failed retest of resistance level -5036
Failed retest of support level– 5023 (watch for buyers near 5020 and 5014.75)
Opening target ranges –5031.75, 5025.50, 5021.50, 5017.25, 5013.75, 5010.25, 5007.50, 5004.75, 4997.75, 4994.75, 4991.50, 4985.50, and 4978.75
Crude Oil –WTI
Charts rallied sharply at the bounce off 50.8 in what I consider an unusual move as the EIA reported a larger than anticipated build with a large build in gasoline and distillates. However, our levels kept us on the right side of the trade as we held key support early.
Buying pressure will likely strengthen with a positive retest of 52.8. Selling pressure will strengthen with a failed retest of 52.03-watch for a group of buyers near 51.76
Price resistance sits near 52.8 to 53.46, with 53.78 and 54.28 above that.
Price support holds between 51.4 and 51.04, with 50.8 and 50.48 below that.
Upside trades – Two options
Positive retest of continuation level -52.8(needs confirmation with positive retest)
Positive retest of support level– 52.09 (watch 52.37 for trouble)
Opening target ranges –52.39, 52.6, 52.78, 53.03, 53.23, 53.46, 53.82, 54.12, 54.28, 54.51, 54.76, 55.06, and 55.24
Downside trades- Two options
Failed retest of resistance level -51.38 (watch for higher lows to stop flow down – key support point in the chart here)
Failed retest of support level– 52.04 (watch support near 51.76, if a breach up intends to break the cycle)
Opening target ranges –51.78, 51.52, 51.24, 51.04, 50.82, 50.47, 50.3, and 50.16
If you’re interested in the live trading room, it is now primarily stock market futures content, though we do track heavily traded stocks and their likely daily trajectories as well – we begin at 9am with a morning report and likely chart movements along with trade setups for the day.
As long as the trader keeps himself aware of support and resistance levels, risk can be very adequately managed to play in either direction as bottom picking remains a behavior pattern that is developing with value buyers and speculative traders.
Twitter: @AnneMarieTrades
The author trades stock market futures every day and may have a position in mentioned securities at the time of publication. Any opinions expressed herein are solely those of the author, and do not in any way represent the views or opinions of any other person or entity.

: Showing Some Signs of Emerging Strength")

