Stock Market Considerations For Feb 9, 2017
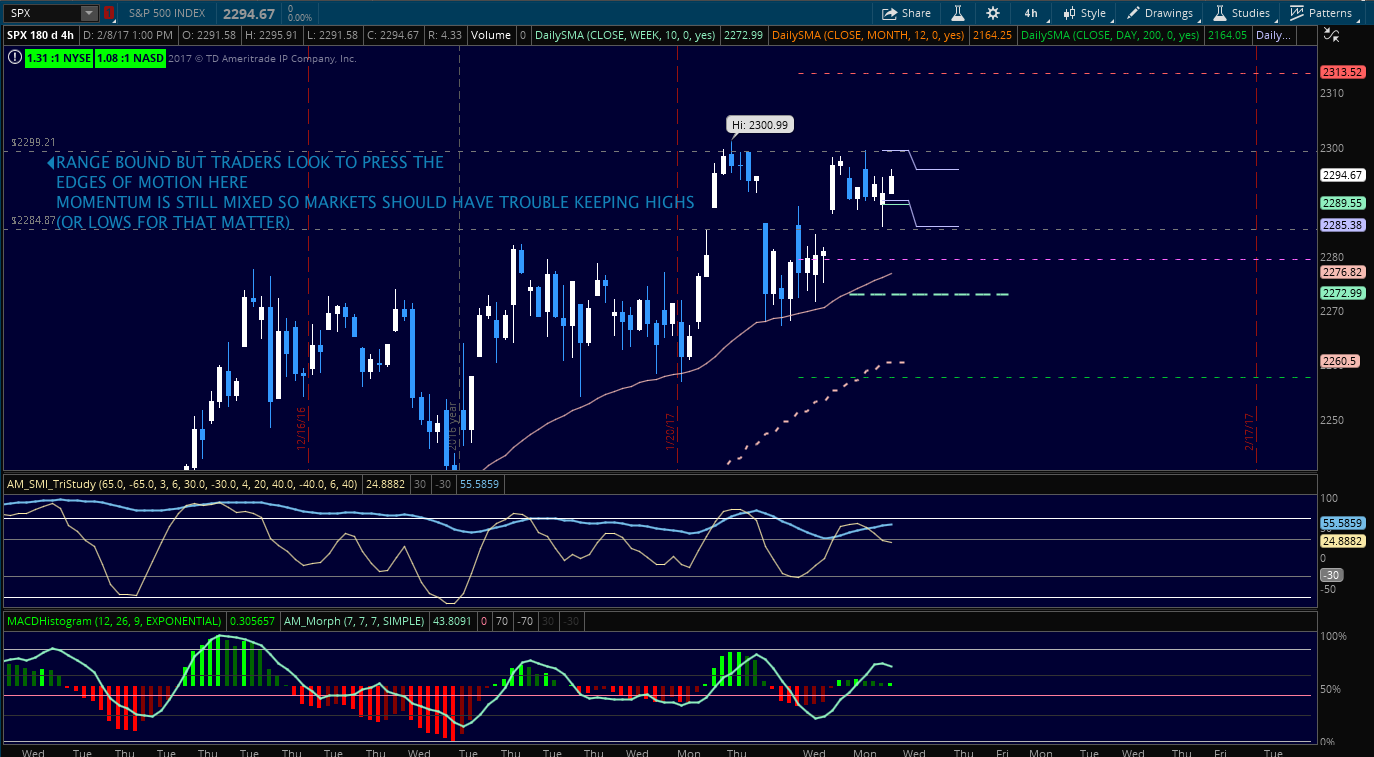
Under mixed momentum, the S&P 500 (INDEXSP:.INX) chart is holding edges of resistance this morning and appears to be moving to test higher highs in the short term cycle. Buyers are still defending support fairly well. Pullbacks on the S&P 500 continue to be bought so pay attention to support zones and do your best not to get caught up in what you think the market ought to be doing and what the market is actually doing.
S&P 500 Futures Levels (ES_F)
Buying pressure will likely strengthen above a positive retest of 2295.5, while selling pressure will strengthen with a failed retest of 2285.5. Price resistance sits near 2297.5 to 2299.5, with 2302.5 and 2305.5 above that.
Price support holds between 2285.25 and 2287, with 2281.75 and 2275 below that
See today’s economic calendar with a rundown of releases.
TODAY’S RANGE OF MOTION
E-mini S&P 500 Futures Trading Outlook For February 9
Upside trades – Two options for entry
- Positive retest of continuation level -2295.25( watch for sellers near 2297.5)
- Positive retest of support level– 2287.75 ( watch also for sellers near 2290.25)
- Opening targets ranges – 2290.25, 2295, 2297.25, 2299.5, 2301.75, 2304.5, 2306.75, 2309.75, 2313.5 , 2320 and 2325
Downside trades – Two options for entry
- Failed retest of resistance level -2297.5
- Failed retest of support level– 2287.75
- Opening target ranges – 2295, 2292.25, 2290, 2287.75, 2285.25, 2283, 2279.75, 2276.25, 2274.25, 2272.25, 2269.5, 2264.5, 2260.5, 2256, 2253.5 and 2249.75
Nasdaq Futures
The NQ_F took its bullish trend and broke to new all time highs once again before retreating from these new highs for the third day running. We hold higher lows which supports the continuing up trend. Momentum remains slightly divergent, but buyers continue to ignore this and hold steady into the march higher. Pullbacks are the best entries long. There is still a rising wedge in play.
- Buying pressure will likely strengthen with a positive retest of 5204.25
- Selling pressure will strengthen with a failed retest of 5181.25
- Resistance sits near 5204.25 to 5210.5, with 5217.25 and 5223.75 above that
- Support holds between 5181.25 and 5178.75, with 5173.5 and 5167 below that
Upside trades – Two options
- Positive retest of continuation level -5195.25
- Positive retest of support level– 5187.5
- Opening target ranges – 5178.75, 5183.5, 5188.25, 5192, 5195, 5201.5, 5204.25, 5210.5, and 5217.25
Downside trades- Two options
- Failed retest of resistance level -5186.5
- Failed retest of support level– 5173.5
- Opening target ranges –5181.25, 5177.75, 5173.75, 5167.25, 5161.5, 5157.25, 5154.5, 5151.5, 5145.5, 5140.5, 5137.5, 5133.25, 5128.5, 5123.75, 5119.75, 5113.25, 5106.5, and 5102.5
Crude Oil –WTI
With a monster build in crude and a draw in gasoline, hedge fund traders who remain net long fueled the trade in oil long off deep support zones. We are setting up with a new lower high, after seeing a lower low in the tighter cycle formations. The line in the sand for the buyers to breach appears to be 53.11, and we’ll head into resistance in the bigger channel once more near 54.4. The failure there at 53.11 could be the start of a move that sends us back to 50.
- Buying pressure will likely strengthen with a positive retest of 53.11
- Selling pressure will strengthen with a failed retest of 52.2
- Resistance sits near 53.34 to 53.65, with 53.88 and 54.3 above that.
- Support holds between 52.06 and 51.78, with 51.54 and 51.2 below that.
Upside trades – Two options
- Positive retest of continuation level -53.11 (watch for sellers at 53.3)
- Positive retest of support level– 52.37
- Opening target ranges – 52.64, 52.86, 53.09, 53.34, 53.6, 53.86, 54.02, 54.19, 54.3, 54.51, 54.76, 55.02, 55.19, and 55.35
Downside trades- Two options
- Failed retest of resistance level -52.84
- Failed retest of support level– 52.4 ( watch 52.03 for buyers)
- Opening target ranges – 52.64, 52.37, 52.2, 52.06, 51.91, 51.72, 51.52, 51.22, 51.04, 50.82, 50.47, 50.3, and 50.16
If you’re interested in the live trading room, it is now primarily stock market futures content, though we do track heavily traded stocks and their likely daily trajectories as well – we begin at 9am with a morning report and likely chart movements along with trade setups for the day.
As long as the trader keeps himself aware of support and resistance levels, risk can be very adequately managed to play in either direction as bottom picking remains a behavior pattern that is developing with value buyers and speculative traders.
Twitter: @AnneMarieTrades
The author trades stock market futures every day and may have a position in mentioned securities at the time of publication. Any opinions expressed herein are solely those of the author, and do not in any way represent the views or opinions of any other person or entity.
: Creating Bullish Divergence?")


: Creating Bullish Divergence?")