Stock Market Futures Trading Overview For February 3, 2017
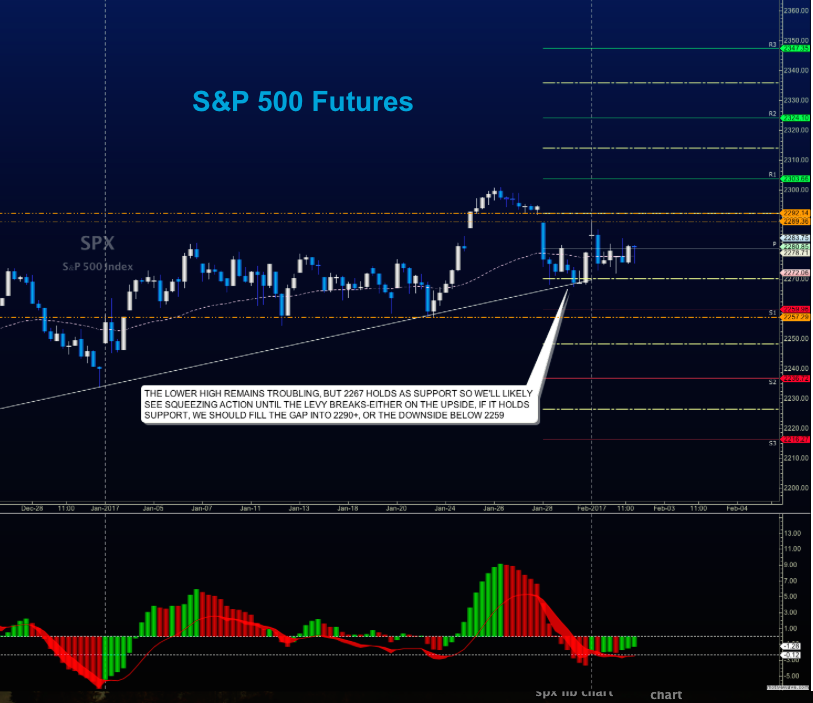
Tight ranges yesterday are being tested on the upside this morning, but momentum is drifting south… that said, the jobs report number could punch the S&P 500 (INDEXSP:.INX) out of this range. So hang tight. Sellers currently sit near 2285-2283 on S&P 500 futures, while buyers sit near 2262.25-2265. How well we hold the move after the jobs report release will likely tell us if we stay out of the range.
- Buying pressure will likely strengthen above a positive retest of 2285
- Selling pressure will strengthen with a failed retest of 2262.25
- Resistance sits near 2281 to 2285, with 2287.5 and 2294.5 above that
- Support holds between 2262.25 and 2257.75, with 2255.75 and 2249 below that
See today’s economic calendar with a rundown of releases.
TODAY’S RANGE OF MOTION
E-mini S&P 500 Futures Trading For February 23
Upside trades – Two options for entry
- Positive retest of continuation level -2280.5( watch for sellers near 2284.5)
- Positive retest of support level– 2271.5 ( watch also for sellers near 2275.25)
- Opening targets ranges -2275.25, 2279, 2280.5, 2282.75, 2285, 2289.75, 2294.25, 2297.25, 2299.5, 2301.75, 2303.5, 2306.75, 2309.75, 2313.5 and 2320
Downside trades – Two options for entry
- Failed retest of resistance level -2280.5
- Failed retest of support level– 2272.25
- Opening target ranges – 2277.5, 2274.25, 2272.25, 2270.5, 2264.5, 2260.5, 2256, 2253.5 and 2249.75
Nasdaq Futures
The NQ_F is caught in a wedge of tightening action as momentum continues to dampen. The bigger picture is still bullish but a range bound formation has the chart holding the pattern into the jobs number. Waiting for the retest on either side.
- Buying pressure will likely strengthen with a positive retest of 5145.75
- Selling pressure will strengthen with a failed retest of 5113.75
- Resistance sits near 5148.5 to 5151.5, with 5153.5 and 5161.5 above that
- Support holds between 5113.75 and 5106.5, with 5094.5 and 5064.5 below that
Upside trades – Two options
- Positive retest of continuation level -5140.5
- Positive retest of support level– 5128.5
- Opening target ranges – 5130.75, 5135.5, 5140.5, 5145.5, 5151.5, 5158.75, 5161.5, 5167.5, 5173.5, 5178.75, 5183.5, and 5188.25
Downside trades- Two options
- Failed retest of resistance level -5141.5
- Failed retest of support level– 5126.5
- Opening target ranges –5137.5, 5133.25, 5128.5, 5123.75, 5119.75, 5113.25, 5106.5, 5102.5, 5097.75, 5094.5, 5083, 5075.75, 5070.5, 5064 and 5058
Crude Oil –WTI
Since testing 54.34 yesterday, oil faded but held higher lows. The chart shows a rising wedge with mixed momentum. Another sideways day seems to be on the horizon.
- Buying pressure will likely strengthen with a positive retest of 54.1
- Selling pressure will strengthen with a failed retest of 53.3
- Resistance sits near 54.34 to 54.51, with 54.81 and 55.03 above that.
- Support holds between 53.3 and 53.04, with 52.86 and 52.66 below that.
Upside trades – Two options
- Positive retest of continuation level -54.05 ( watch for sellers near 54.19)
- Positive retest of support level– 53.64 (watch for sellers near 53.86)
- Opening target ranges –53.86, 54.02, 54.19, 54.3, 54.51, 54.76, 55.02, 55.19, and 55.35
Downside trades- Two options
- Failed retest of resistance level -53.8 ( watch for buyers near 53.54 and 53.35)
- Failed retest of support level– 53.52 (watch for buyers near 53.35)
- Opening target ranges –53.67, 53.48, 53.3, 53.04, 52.86, 52.66, 52.34, 52.08, 51.78, 51.52, 51.24, 51.04, 50.82, 50.47, 50.3, and 50.16
If you’re interested in watching these trades go live, join us in the live trading room from 9am to 11:30am each trading day.
Visit TheTradingBook for more information.
If you’re interested in the live trading room, it is now primarily stock market futures content, though we do track heavily traded stocks and their likely daily trajectories as well – we begin at 9am with a morning report and likely chart movements along with trade setups for the day.
As long as the trader keeps himself aware of support and resistance levels, risk can be very adequately managed to play in either direction as bottom picking remains a behavior pattern that is developing with value buyers and speculative traders.
Twitter: @AnneMarieTrades
The author trades stock market futures every day and may have a position in mentioned securities at the time of publication. Any opinions expressed herein are solely those of the author, and do not in any way represent the views or opinions of any other person or entity.

: Showing Some Signs of Emerging Strength")
