S&P 500 Futures Trading Considerations For February 15, 2017
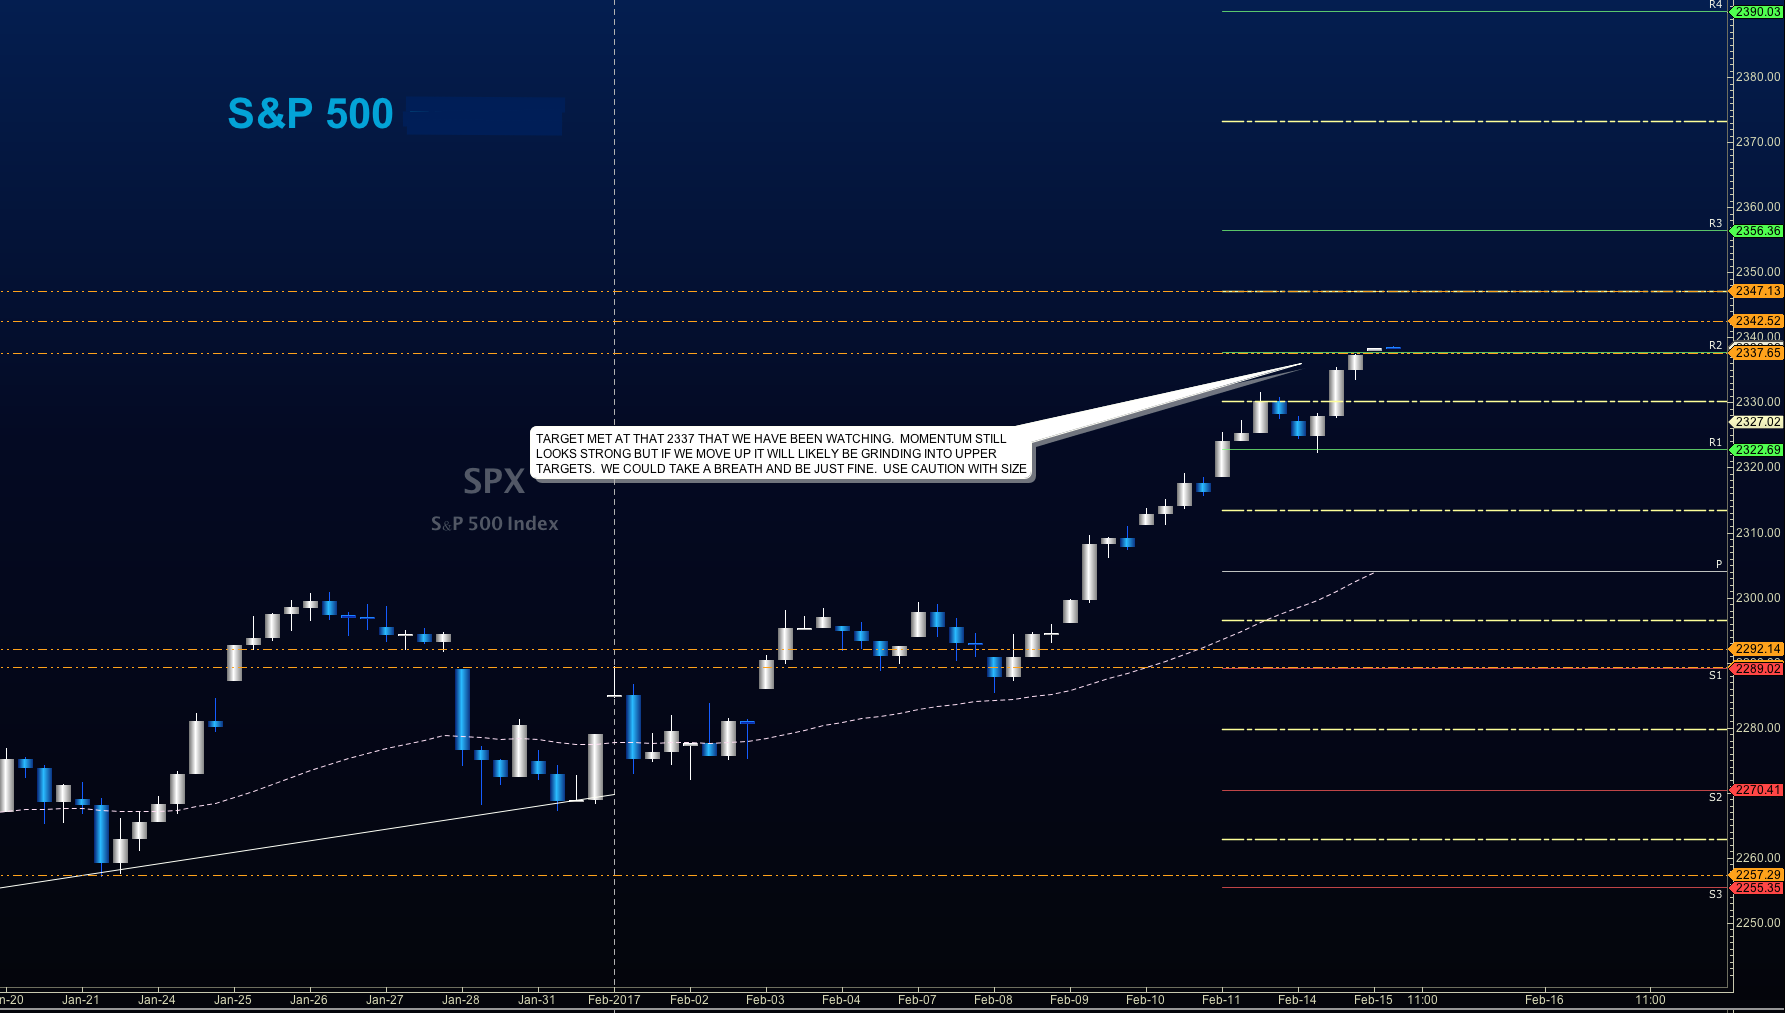
S&P 500 futures hit new highs overnight but have since pulled back into support near 2334.
The S&P 500 (INDEXSP:.INX) is at a key level of resistance but bullish formations tell us that fades of price into support will be bought in the near-term. Failed retests of 2334 could make traders a little nervous – but only into the next support level below. Trending formations hold steady – this means reversal trades become quite dangerous.
Buying pressure will likely strengthen above a positive retest of 2338, while selling pressure will strengthen with a failed retest of 2329. Price resistance sits near 2340 to 2342.5, with 2346.75 and 2353.25 above that. Price support holds between 2329 and 2323.5, with 2319.5 and 2313.25 below that
See today’s economic calendar with a rundown of releases.
TODAY’S RANGE OF MOTION
E-mini S&P 500 Futures – February 15
Upside trades – Two options for entry
- Positive retest of continuation level -2329
- Positive retest of support level– 2319
- Opening targets ranges – 2322.5, 2328.75, 2332.5, 2336.25, and 2341.25
Downside trades – Two options for entry
- Failed retestof resistance level -2322.5 (careful here – very countertrend though toppy)
- Failed retestof support level– 2318.5
- Opening target ranges – 2319, 2315.25, 2313, 2309.75, 2304.75, 2302.75, 2299.5, 2297, 2294.25, 2291.75, 2288.5, 2284.5, 2279.75, 2276.25, 2274.25, 2272.25, 2269.5, 2264.5, 2260.5, 2256, 2253.5 and 2249.75
Nasdaq Futures
The NQ_F also presented with a new high in the Globex event and holds in a bullish trend. A fade to support is quite likely here. A rotation down into the top of the channel yesterday is the proposed track. How well the bounce holds with momentum will give us future motion clues. So far, the trend holds steady so pullbacks will hold, at least into lower highs if the chart loses power and begins to roll over.
- Buying pressure will likely strengthen with a positive retest of 5285.25
- Selling pressure will strengthen with a failed retest of 5263.25
- Resistance sits near 5285.25 to 5293, with 5297.75 and 5306.5 above that
- Support holds between 5263.25 and 5252.5, with 5246.25 and 5240 below that
Upside trades – Two options
- Positive retest of continuation level -5280.25
- Positive retest of support level– 5271.25
- Opening target ranges – 5259, 5261.5, 5263, 5271.25, 5274.5, 5280.75, 5285.25, 5293, 5297.75, and 5306.5
Downside trades- Two options
- Failed retest of resistance level -5279.25
- Failed retest of support level– 5271.25
- Opening target ranges –5273.75, 5271.25, 5267.25, 5263.25, 5259, 5252.75, 5246.75, 5240.25, 5235.25, 5229.75, 5227.75, 5221.75, 5217.75, 5212.5, 5207.5, 5202.25, 5197, 5186.25, 5180, 5173.75, 5167.25, 5161.5, 5157.25, 5154.5, 5151.5, 5145.5, and 5140.5
Crude Oil –WTI
Oil held steady in the congestion region after the API report, and now we wait on EIA releases today. Interesting undercurrents here – with divergent themes of information. I expect a failed test of resistance and a fade. The range between 51.5 and 54.3 remains uncontested.
- Buying pressure will likely strengthen with a positive retest of 54.05
- Selling pressure will strengthen with a failed retest of 52.7
- Resistance sits near 53.46 to 53.68, with 53.88 and 54.05 above that.
- Support holds between 52.63 and 52.37, with 52.2 and 51.78 below that.
Upside trades – Two options
- Positive retest of continuation level -53.2
- Positive retest of support level– 52.86
- Opening target ranges – 53.01, 53.35, 53.68, 53.9, 54.05, 54.19, 54.34, 54.51, 54.76, 55.02, 55.19, and 55.35
Downside trades- Two options
- Failed retest of resistance level -53.2
- Failed retest of support level– 52.72
- Opening target ranges –52.85, 53.06, 52.86, 52.64, 52.37, 52.2, 52.06, 51.91, 51.72, 51.52, 51.22, 51.04, 50.82, 50.47, 50.3, and 50.16
If you’re interested in the live trading room, it is now primarily stock market futures content, though we do track heavily traded stocks and their likely daily trajectories as well – we begin at 9am with a morning report and likely chart movements along with trade setups for the day.
As long as the trader keeps himself aware of support and resistance levels, risk can be very adequately managed to play in either direction as bottom picking remains a behavior pattern that is developing with value buyers and speculative traders.
Twitter: @AnneMarieTrades
The author trades stock market futures every day and may have a position in mentioned securities at the time of publication. Any opinions expressed herein are solely those of the author, and do not in any way represent the views or opinions of any other person or entity.


: Showing Some Signs of Emerging Strength")
