Stock Market Futures Considerations For February 13, 2017
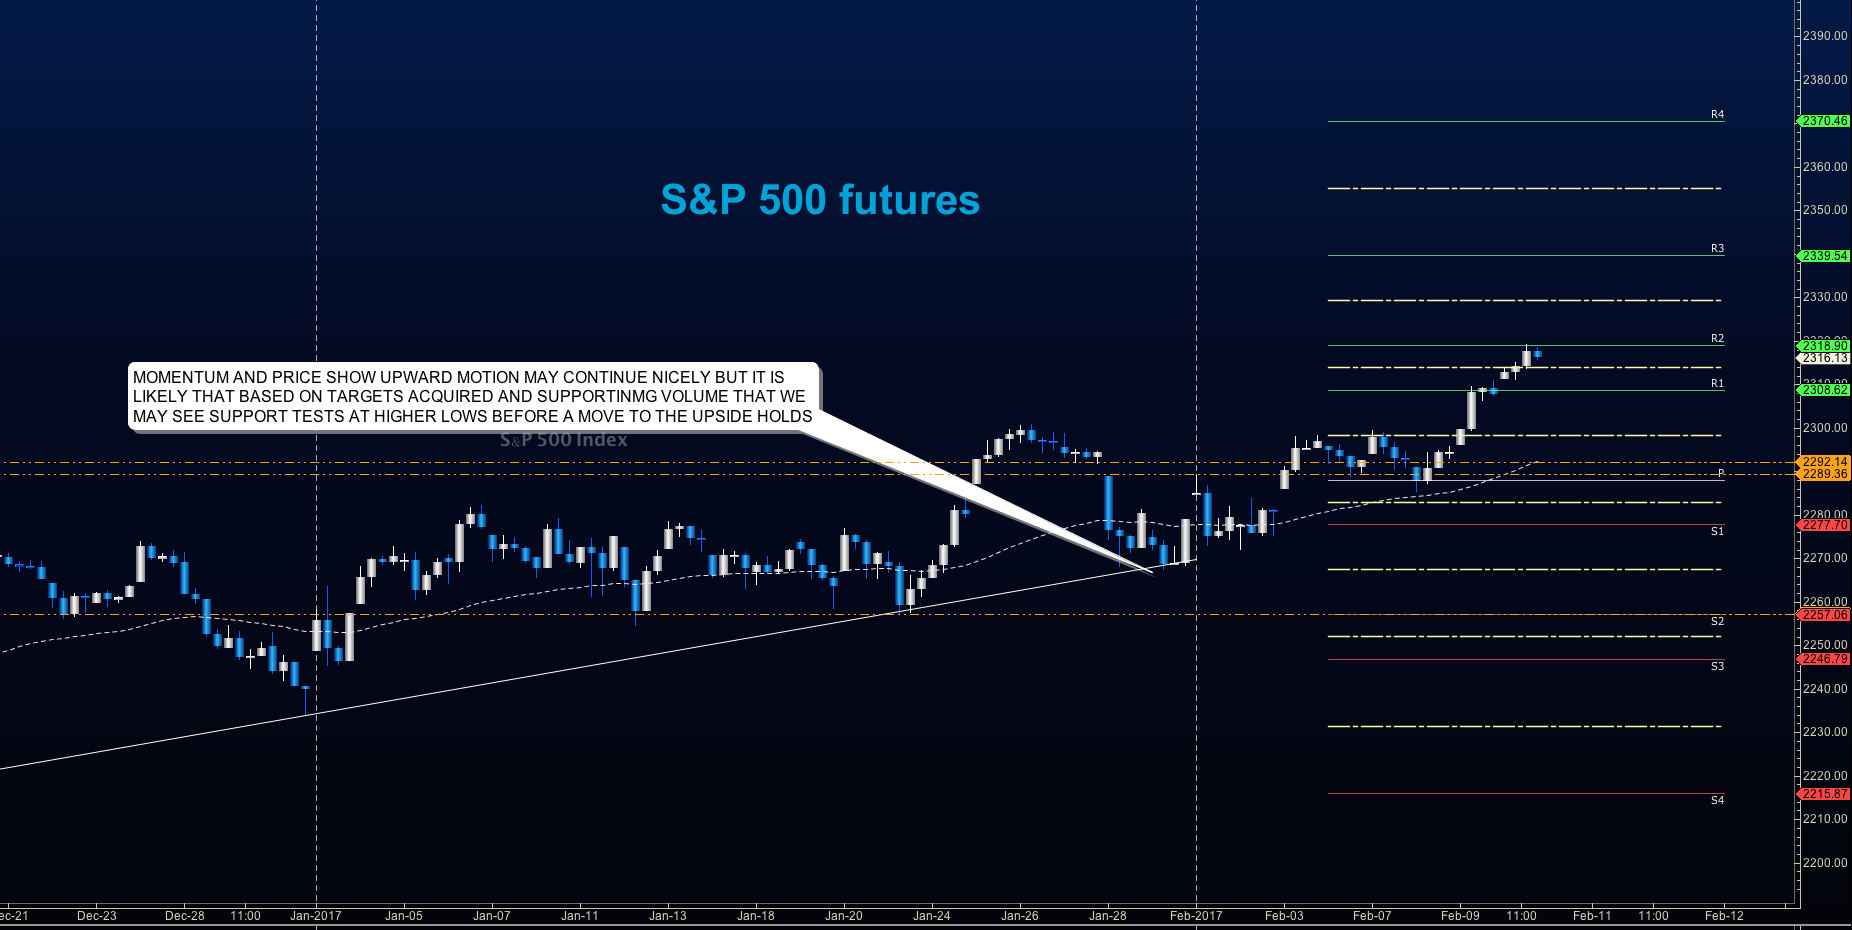
Another morning with new all-time highs greet us on S&P 500 futures and the cash index (INDEXSP:.INX). Market pullbacks are still likely to be bought as we sit at regions that could prove out as target regions for buyers trading to resistance. Price targets above look like 2320.5 and 2322.5 at this writing (on a breach and hold 2318). The support region looks like 2290 at a weekly glance, but higher near 2303 on the intraday frames. The backdrop is quite trending to trying to pick tops here could be quite hazardous to your portfolio health.
Buying pressure will likely strengthen above a positive retest of 2318.5, while selling pressure will strengthen with a failed retest of 2313
Price resistance on S&P 500 futures sits near 2318 to 2320.5, with 2322.5 and 2327.5 above that. Price support holds between 2303 and 2306.75, with 2299 and 2291.75 below that
See today’s economic calendar with a rundown of releases.
TODAY’S RANGE OF MOTION
E-mini S&P 500 Futures Trading Outlook For February 13
Upside trades – Two options for entry
- Positive retest of continuation level -2316.75
- Positive retest of support level– 2313.5
- Opening targets ranges – 2316.5 , 2318, 2320.5, 2322.5, 2327.75, and 2332.5
Downside trades – Two options for entry
- Failed retest of resistance level -2312.5 (careful here – very countertrend though toppy)
- Failed retest of support level– 2309.5
- Opening target ranges – 2309.75, 2304.75, 2302.75, 2299.5, 2297, 2294.25, 2291.75, 2288.5, 2284.5, 2279.75, 2276.25, 2274.25, 2272.25, 2269.5, 2264.5, 2260.5, 2256, 2253.5 and 2249.75
Nasdaq Futures
The NQ_F holds its bullish trend and is sitting near highs set overnight once again. Breakout action should be tested at first by sellers but could easily resume the forward press as much seems to favor higher levels in the NQ_F. Reversion to the mean trades continue to prove out as quite difficult. Remember, relationships change over time, and that includes the ones in the market. Momentum remains slightly divergent, but buyers continue to buy and hold support higher. Use caution with size up here for timing will become more important the longer the stretch continues without significant retracements of support levels.
- Buying pressure will likely strengthen with a positive retest of 5235
- Selling pressure will strengthen with a failed retest of 5202.25
- Resistance sits near 5235.25 to 5240.5, with 5246.25 and 5252.5 above that
- Support holds between 5202.25 and 5197, with 5186.25 and 5180 below that
Upside trades – Two options
- Positive retest of continuation level -5235.25
- Positive retest of support level– 5223.5
- Opening target ranges – 5227, 5231.25, 5235, 5240.25 and 5246
Downside trades- Two options
- Failed retest of resistance level -5232.25
- Failed retest of support level– 5223.5.5
- Opening target ranges –5229.75, 5226.75, 5221.75, 5217.75, 5212.5, 5207.5, 5202.25, 5197, 5186.25, 5180, 5173.75, 5167.25, 5161.5, 5157.25, 5154.5, 5151.5, 5145.5, and 5140.5
Crude Oil –WTI
For six out of the last twelve days, oil has tested 54.05 and higher only to retreat to clear value areas of support. Hedge funds seem to be moving their long positions off in general but pressure still shows them to be bullish overall. The range between 51.5 and 54.3 remains uncontested.
- Buying pressure will likely strengthen with a positive retest of 54.4
- Selling pressure will strengthen with a failed retest of 52.9
- Resistance sits near 54.05 to 54.35, with 54.54 and 54.7 above that.
- Support holds between 52.9 and 52.63, with 52.26 and 51.56 below that.
Upside trades – Two options
- Positive retest of continuation level -53.92 (watch for sellers at 54.06)
- Positive retest of support level– 53.39
- Opening target ranges – 53.68, 53.88, 54.06, 54.19, 54.34, 54.51, 54.76, 55.02, 55.19, and 55.35
Downside trades- Two options
- Failed retest of resistance level -53.68
- Failed retest of support level– 53.2 ( watch 52.9 for buyers)
- Opening target ranges – 53.39, 53.21, 53.02, 52.9, 52.64, 52.37, 52.2, 52.06, 51.91, 51.72, 51.52, 51.22, 51.04, 50.82, 50.47, 50.3, and 50.16
If you’re interested in watching these trades go live, join us in the live trading room from 9am to 11:30am each trading day.
Visit TheTradingBook for more information.
If you’re interested in the live trading room, it is now primarily stock market futures content, though we do track heavily traded stocks and their likely daily trajectories as well – we begin at 9am with a morning report and likely chart movements along with trade setups for the day.
As long as the trader keeps himself aware of support and resistance levels, risk can be very adequately managed to play in either direction as bottom picking remains a behavior pattern that is developing with value buyers and speculative traders.
Twitter: @AnneMarieTrades
The author trades stock market futures every day and may have a position in mentioned securities at the time of publication. Any opinions expressed herein are solely those of the author, and do not in any way represent the views or opinions of any other person or entity.

: Creating Bullish Divergence?")


: Creating Bullish Divergence?")

