Stock Market Outlook for December 7, 2016 –
Though the S&P 500 (INDEXSP:.INX) is creeping higher, it is doing so under lighter volume. As I said yesterday, a lighter news flow may keep the stock market range bound into next week’s FOMC announcement. The line in the sand for buyers today will be near 2197-2200.50 on S&P 500 futures. Price support levels to watch below that level are 2194-2191. Price resistance is now prior support zones at 2210.75-2213.75. A breach over those levels means we are back to the upside breakout formation looking at 2220-2223, and possibly higher. Momentum is now bullish, but not increasing.
See today’s economic calendar with a rundown of releases.
TODAY’S RANGE OF MOTION
S&P 500 Futures Trading Chart – December 7
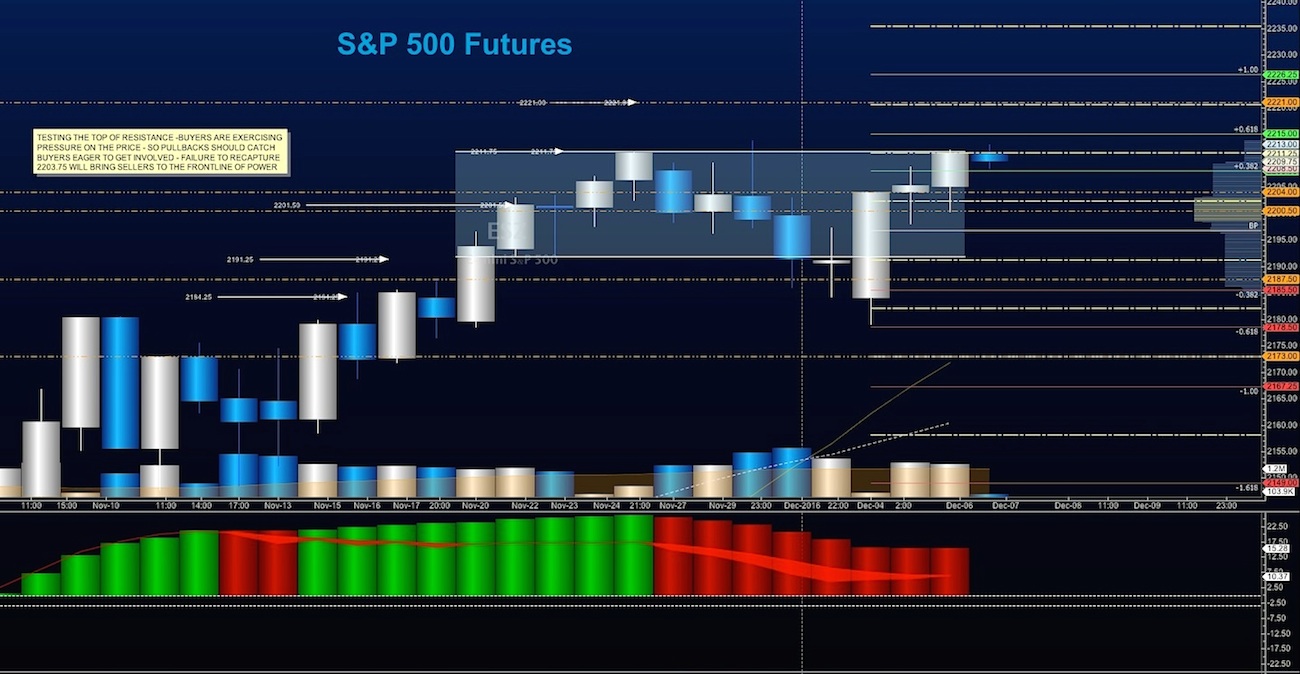
Upside trades – Two options for entry
Positive retest of continuation level – 2213.50
Positive retest of support level – 2208
Opening targets ranges – 2210.75, 2213, 2215.50, 2217.75, and 2220.25
Downside trades – Two options for entry
Failed retest of resistance level – 2208
Failed retest of support level – 2203.50
Opening target ranges – 2206.50, 2203.75, 2201.5, 2197.75, 2195.75, 2192.25, 2187.75, 2184.25, 2181.50, 2179.50, and 2177.75
Nasdaq Futures
The NQ_F also has crept north, but a tight range of activity over the last 24 hours. The line in the sand today sits near 4760-4768 for buyers holding control of the chart. Pullbacks should still find as momentum is positive, but the real test will be how well it can hold any tests near 4797. Resistance still holds near 4806.50 to 4818.
Upside trades – Two options
Positive retest of continuation level – 4797.50
Positive retest of support level – 4768.50
Opening target ranges for non-members – 4772.25, 4775.50, 4790.50, 4805.75, 4811, and 4818.50
Downside trades – Two options
Failed retest of resistance level – 4804.50
Failed retest of support level – 4767.50
Opening target ranges – 4801.25, 4797.75, 4792.50, 4787.50, 4782.25, 4776.50, 4770.50, 4765.75, 4760.75, 4756.50, 4748.25, 4726.75, and 4717.75 if the chart continues to fade
Crude Oil
The EIA report will be released at 10:30am ET today. The chart is range bound, but support looks like 50.50 and below that, 50.13. We continue to create lower higher. The edges of resistance sit between 51.68 and 52.24. Traders continue to battle in the range.
Upside trades – Two options
Positive retest of continuation level – 51.78 (lots of sellers remain between 52.02 and 52.22)
Positive retest of support level – 50.55
Opening target ranges – 50.91, 51.08, 51.35, 51.74, 51.97, 52.02, 52.24, 52.47, 53.03, and 53.54
Downside trades – Two options
Failed retest of resistance level – 51.04
Failed retest of support level – 50.82
Opening target ranges – 50.89, 50.65, 50.27, 50.09, 49.87, 49.47, 49.12, and 48.85
If you’re interested in the live trading room, it is now primarily stock market futures content, though we do track heavily traded stocks and their likely daily trajectories as well – we begin at 9am with a morning report and likely chart movements along with trade setups for the day.
As long as the trader keeps himself aware of support and resistance levels, risk can be very adequately managed to play in either direction as bottom picking remains a behavior pattern that is developing with value buyers and speculative traders.
Twitter: @AnneMarieTrades
The author trades stock market futures every day and may have a position in mentioned securities at the time of publication. Any opinions expressed herein are solely those of the author, and do not in any way represent the views or opinions of any other person or entity.


: Showing Some Signs of Emerging Strength")
