Stock Market Outlook for December 2, 2016 –
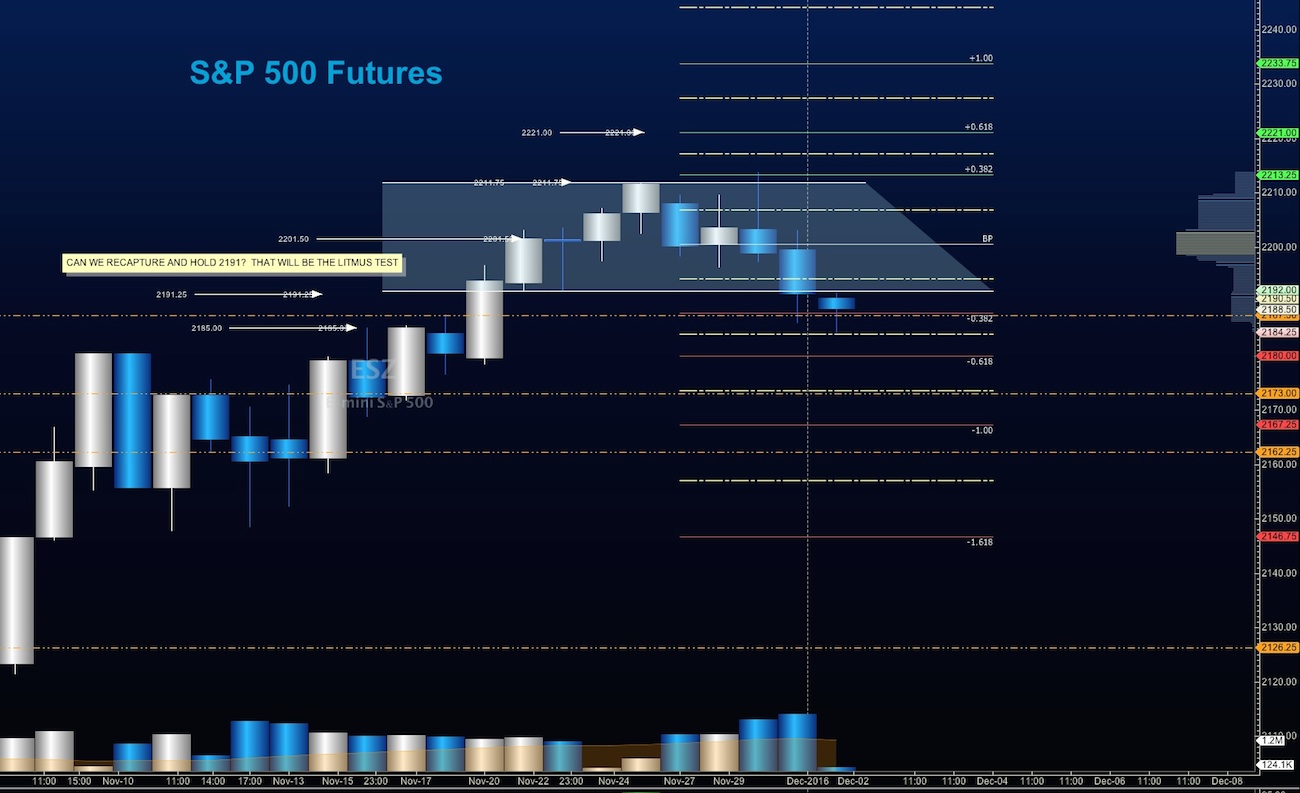
The job numbers are released today at 8:30am ET and will provide volatility. Critical price support levels for the S&P 500 (INDEXSP:.INX) were broken yesterday. And this morning we tested our final target of the short for the setup in yesterday’s blog. Selling pressure is strong, but there is a bounce ahead. The line in the sand for S&P 500 futures buyers will be near 2187.75 today. Price support levels to watch below that are 2184 and 2181. Price resistance is now prior support around 2190-2194. A breach over those levels and we will likely see upside pressure. Stock market futures momentum remains mildly bullish in form, but still under pressure.
See today’s economic calendar with a rundown of releases.
TODAY’S RANGE OF MOTION
S&P 500 Futures Trading Chart – December 1
Upside trades – Two options for entry
Positive retest of continuation level -2187.75
Positive retest of support level– 2184.50
Opening targets ranges for non-members -2187.50, 2189.75, 2191.50, 2194.50, 2197.50, 2200.75, 2203.75, and 2206.75
Downside trades – Two options for entry
Failed retest of resistance level -2187
Failed retest of support level– 2184
Opening target ranges for non-members – 2184.25, 2181.50, 2179.50, and 2177.75
Nasdaq Futures
The NQ_F continues its underperformance and sits below after more than a 100 point move to the south. The bounce zone holds at 4706, but a fade there allows us to move into 4791 and possibly 4688. This has been a damaging move but on larger time frames, we are still well with the range of motion we have held through July. Resistance sits at 4735 to 4753.
Upside trades – Two options
Positive retest of continuation level -4722.50
Positive retest of support level– 4709.50
Opening target ranges for non-members –4711.50, 4717.50, 4722.25, 4724.75, 4729.75, 4735.75, 4741.25, 4747.75, and 4753.50
Downside trades- Two options
Failed retest of resistance level -4720.50
Failed retest of support level– 4707
Opening target ranges for non-members –4720.75, 4717.75, 4707.75,4701.75, 4692.25, and 4680.25 if the chart continues to fade
Oil –WTI Crude
Oil ran just into prior recent highs but could not breach – profit taking is present here so we will look for bounces that potentially fade into lower highs that may bring us back to 49.04. Support holds at 50.12 and below there 49.4. Resistance rests between 50.94 and 51.65.
Upside trades – Two options
Positive retest of continuation level -50.78
Positive retest of support level– 49.94
Opening target ranges for non-members – 50.12, 50.24, 50.48, 50.70, 50.94, and 51.56
Downside trades- Two options
Failed retest of resistance level -50.70
Failed retest of support level– 49.84
Opening target ranges for non-members –49.95, 49.68, 49.42, 49.13, 48.81, 48.57, 48.27 and 48.04
If you’re interested in watching these trades go live, join us in the live trading room from 9am to 11:30am each trading day.
Visit TheTradingBook for more information.
If you’re interested in the live trading room, it is now primarily stock market futures content, though we do track heavily traded stocks and their likely daily trajectories as well – we begin at 9am with a morning report and likely chart movements along with trade setups for the day.
As long as the trader keeps himself aware of support and resistance levels, risk can be very adequately managed to play in either direction as bottom picking remains a behavior pattern that is developing with value buyers and speculative traders.
Twitter: @AnneMarieTrades
The author trades stock market futures every day and may have a position in mentioned securities at the time of publication. Any opinions expressed herein are solely those of the author, and do not in any way represent the views or opinions of any other person or entity.


: Showing Some Signs of Emerging Strength")
