Stock Market Outlook for December 19, 2016 –
A wedge continues to build on the S&P 500 (INDEXSP:.INX) without resolution. Choppy and wicky price action is likely for today. With the possibility of a ‘Santa Claus’ rally on the horizon and traders reminding us of a possible ‘January effect’, upside for stocks is clearly not out of the question. However, we do have to be careful simply assuming that it is on the horizon. That’s where most of us get into trouble. Levering on assumption rather than empirical evidence.
Watch for the confirmation of those price levels noted before getting involved. It is much better to manage risk thresholds this way. The line in the sand for buyers to hold will be 2246, and below that, 2240. Price resistance remains 2269, but could breach to test 2272.50, then 2282.75, if the charts continue with higher lows.
See today’s economic calendar with a rundown of releases.
TODAY’S RANGE OF MOTION
E-mini S&P 500 Futures Trading Chart For December 19
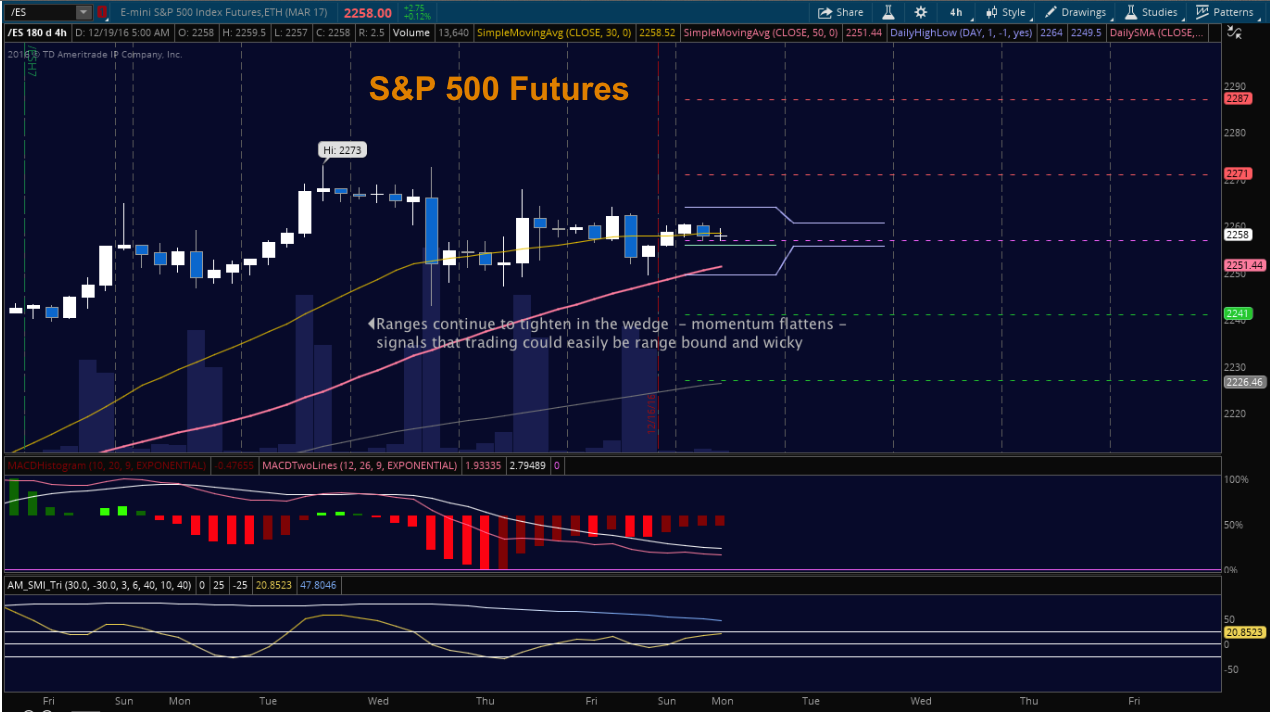
Upside trades – Two options for entry
Positive retest of continuation level – 2261.25
Positive retest of support level – 2251.5
Opening targets ranges – 2254.50, 2257.25, 2260.50, 2263.75, 2267.75, 2270.25, 2273, 2275.50, 2278.25 and 2282.50
Downside trades – Two options for entry
Failed retest of resistance level – 2260.75 (needs confirmation)
Failed retest of support level – 2250.25 (also needs confirmation due to price forms)
Opening target ranges – 2257, 2254.75, 2251.5, 2249.50, 2246.50, 2242.75, 2238.75, 2234.75, 2231.50, 2227.75, 2224.25, and 2224.25
Nasdaq Futures
The NQ_F is forming a messy channel with support drifting lower. This morning the ranges are very tight, and so we’ll be looking for a breach of price action. Momentum is drifting lower. Patterns are messy, and low probabilities of continuation make it high risk to participate without form taking hold. Resistance now holds near 4930 to 4941. There is an auction vacuum that sits in the range between 4878 and 4890.
Upside trades – Two options
Positive retest of continuation level – 4924.50 (needs confirmation)
Positive retest of support level – 4913.50 (also needs confirmation)
Opening target ranges – 4918.25, 4924.25, 4930.25, 4934.50, 4939.75, 4942.25, 4947, 4959.75, 4965.50, and 4988.75
Downside trades – Two options
Failed retest of resistance level – 4938.50 (careful here – negative divergence needs to be present)
Failed retest of support level – 4913.75
Opening target ranges – 4934.25, 4930.50, 4925.75, 4920.75, 4914.25, 4907.50, 4902.75, 4898.75, 4883.75, 4876.25, 4872.25, 4863.75, 4859.75, 4854.75, and 4847.50
WTI Crude Oil
Charts are range bound here with bounce action looks present near 52.09, and potentially 51.56 below that. Resistance is near 53.59 for now and should buyers press forward, the positive retest of this region represents long opportunities into higher levels near 54.1. Formations suggest that bounces should find sellers, but that the chart would not be likely to collapse under selling weight as buyers have been holding us above 50.65 which holds as a breakout event in the current form.
Upside trades – Two options
Positive retest of continuation level – 53.25
Positive retest of support level – 51.56
Opening target ranges – 51.92, 52.34, 52.64, 52.86, 53.23, 53.41, 53.8, 54.04, 54.21, 54.5, 54.97, and 55.4
Downside trades- Two options
Failed retest of resistance level – 53.2
Failed retest of support level – 52.5 –
Opening target ranges – 52.87, 52.55, 52.3, 52.09, 51.85, 51.57, 51.32, 51.08, 50.27, 50.13, 49.87, 49.6, 49.27, 49.05, and 48.92
If you’re interested in watching these trades go live, join us in the live trading room from 9am to 11:30am each trading day.
Visit TheTradingBook for more information.
If you’re interested in the live trading room, it is now primarily stock market futures content, though we do track heavily traded stocks and their likely daily trajectories as well – we begin at 9am with a morning report and likely chart movements along with trade setups for the day.
As long as the trader keeps himself aware of support and resistance levels, risk can be very adequately managed to play in either direction as bottom picking remains a behavior pattern that is developing with value buyers and speculative traders.
Twitter: @AnneMarieTrades
The author trades stock market futures every day and may have a position in mentioned securities at the time of publication. Any opinions expressed herein are solely those of the author, and do not in any way represent the views or opinions of any other person or entity.


: Showing Some Signs of Emerging Strength")
