Stock Market Futures Outlook for August 9, 2016 (ES_F Broad Overview) –
Trading in S&P 500 futures has been quiet and bound in a tight range as price consolidates at higher levels. Momentum continues as bullish patterns, but confined by the recent price consolidation. S&P 500 futures are retesting 2177 at this writing. Price support sits near 2172, and below that we see 2168.5. More congestion lies in the 2166.5 region. Price resistance remains 2183, but could stretch into 2187.5 today if traders expand the range. That said, if this upper level is breached, it should get retested. In short, the S&P 500 (INDEXSP:.INX) is still rangebound until a key level is taken out.
See today’s economic calendar with a rundown of releases.
RANGE OF TODAY’S MOTION
S&P 500 Futures Trading Outlook – Chart (ES_F)
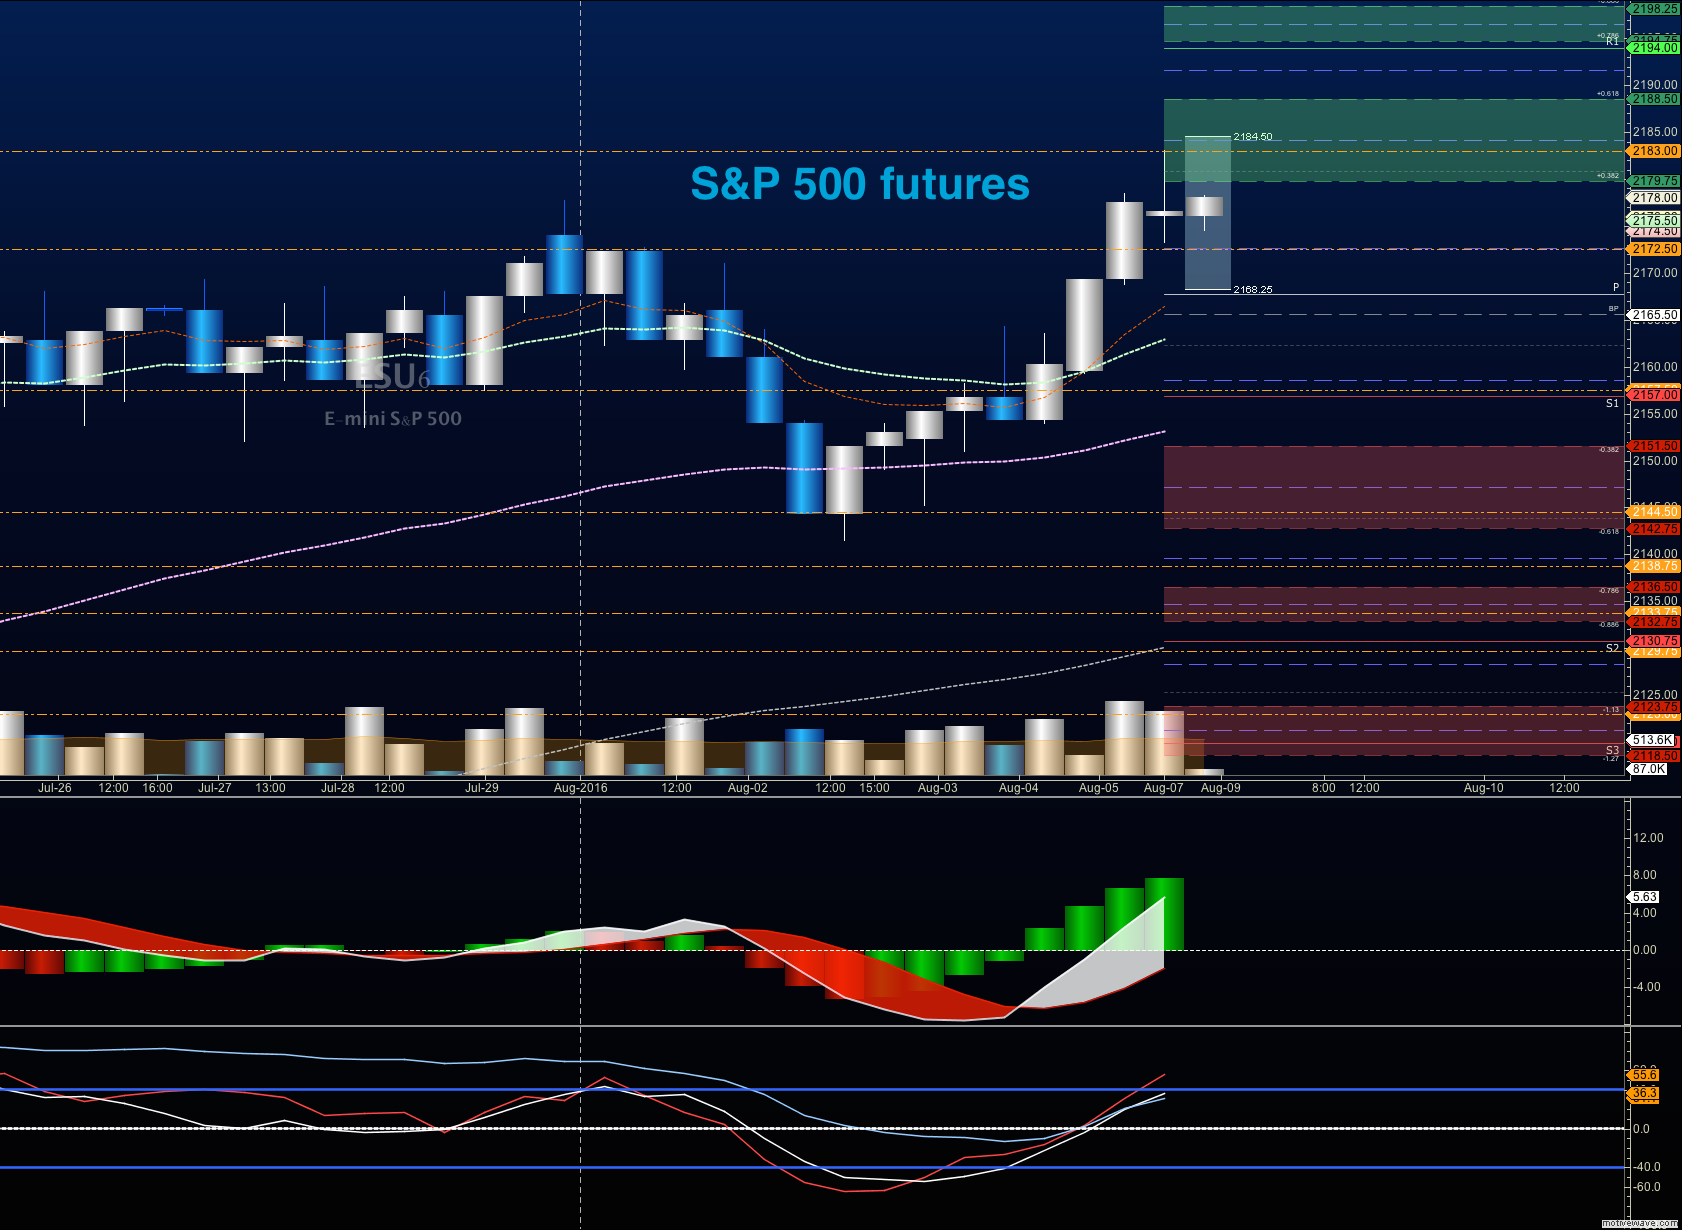
Upside trades on S&P 500 futures – Favorable setups sit on the positive retest of 2178, or a positive retest of the bounce off 2174.5 with positive momentum. I use the 30min to 1hr chart for the breach and retest mechanic. Targets from 2174.5 are 2176.75, 2179, 2181.25, 2183, 2184.5, 2187.5 and if we expand, we may stretch above into 2189.75 and 2190.5. That would be accompanied by a renewed bullish tone and stock market futures outlook.
Downside trades on S&P 500 futures – Favorable setups sit below the failed retest of 2173.75 or at the first failed retest of 2181.25 with negative divergence. Keep your eyes on the lookout for higher lows developing intraday. Retracement into lower levels from 2181.5 gives us the targets 2178.5, 2176.75, 2174.75, 2172.5, 2169.5, 2166.75, 2164.5, 2161.5, 2159.5, 2156.75, and 2153.5, if sellers take over.
If you’re interested in watching these trades go live, join us in the live trading room from 9am to 11:30am each trading day.
Nasdaq Futures (NQ_F)
The NQ_F continues to build momentum, and has bounced off support near 4771. Below that, we see 4766.25 as lower support. Resistance levels are now between 4794-4808.75, with a breach that could stretch into 4822 in the coming days, before the chart retreats. Buying breakouts have not been the best bet for traders, but the retests of support action have worked nicely, and should continue to do so.
Upside trades on Nasdaq futures – Favorable setups sit on the positive retest of 4787.25, or a positive retest of 4777.5 with positive momentum. I use the 30min to 1hr chart for the breach and retest mechanic. Targets from 4777.5 are 4781.75, 4787.25, 4791, 4793.75, 4795.5, 4798.5, 4800.75, 4804, 4808.5, 4812, and 4816.25 to 4822.25, if buyers continue the rally north.
Downside trades on Nasdaq futures – Favorable setups sit below the failed retest of 4777, or at the failed retest of 4791.5 with negative divergence. Retracement into lower levels from 4791.5 gives us the targets 4787.5, 4784.25, 4781.5, 4776.75, 4772.25, 4766.5, 4762.25, 4754.5, 4746.75, 4743.5, 4739.75, 4735.75, 4730.5, and 4726.5 to 4721.5, if sellers resume control.
Crude Oil
Oil prices bounced right into our resistance level near 43.4, stopping at 43.39, retreating (as expected – see yesterday’s post), and then attempting but failing a retest of the prior high made yesterday. API reports after the close with a draw of 1MM barrels projected. Support looks to be in the vicinity of 42.24, but aggressive selling could bring the chart into 41.46. Pullbacks are still likely to be bought in the current cycle, even as significant resistance is present ahead.
Trading ranges for crude oil should hover between 42.24 and 43.57, with the number near 42.2 being a very important number for the chart to hold, or recapture, if we are buyers.
Upside trades in crude oil can be staged on the positive retest of 43.4, or at a bounce off 42.74 with positive momentum. I often use the 30min to 1hr chart for the breach and retest mechanic. Targets from 42.54 are 42.74, 42.9, 43.12, 43.32, 43.57, 43.7, 43.9, and perhaps, 44.14, if buyers really take control.
Downside trades in crude oil can be staged on the failed retest of 42.7, or at the failed retest of 43.3 with negative divergence. Targets from 43.3 are 43.11, 42.97, 42.81, 42.7, 42.46, 42.24, 42.11, 41.98, 41.75, 41.63, 41.54, 41.4, 41.16, 40.94, 40.77, 40.57, 40.34, 40.19, 39.87, 39.56, 39.38, 39.26, 39.02, 38.74, 38.42 and 38.22, but these downward levels seem quite unlikely at this time.
If you’re interested in the live trading room, it is now primarily stock market futures content, though we do track heavily traded stocks and their likely daily trajectories as well – we begin at 9am with a morning report and likely chart movements along with trade setups for the day.
As long as the trader keeps himself aware of support and resistance levels, risk can be very adequately managed to play in either direction as bottom picking remains a behavior pattern that is developing with value buyers and speculative traders.
Twitter: @AnneMarieTrades
The author trades stock market futures every day and may have a position in mentioned securities at the time of publication. Any opinions expressed herein are solely those of the author, and do not in any way represent the views or opinions of any other person or entity.


 Ready To Break Out?")

