Stock Market Futures Trading Considerations For August 4, 2017
The S&P 500 (INDEXSP:.INX) is poised for a breach higher on NFP Friday. The market has traded sideways for the past two weeks so traders will be anxious to get some movement. Stay focused – and see key futures trading levels for the S&P 500, Nasdaq, and Crude Oil below.
Check out today’s economic calendar with a full rundown of releases. And note that the charts below are from our premium service and shared exclusively with See It Market readers.
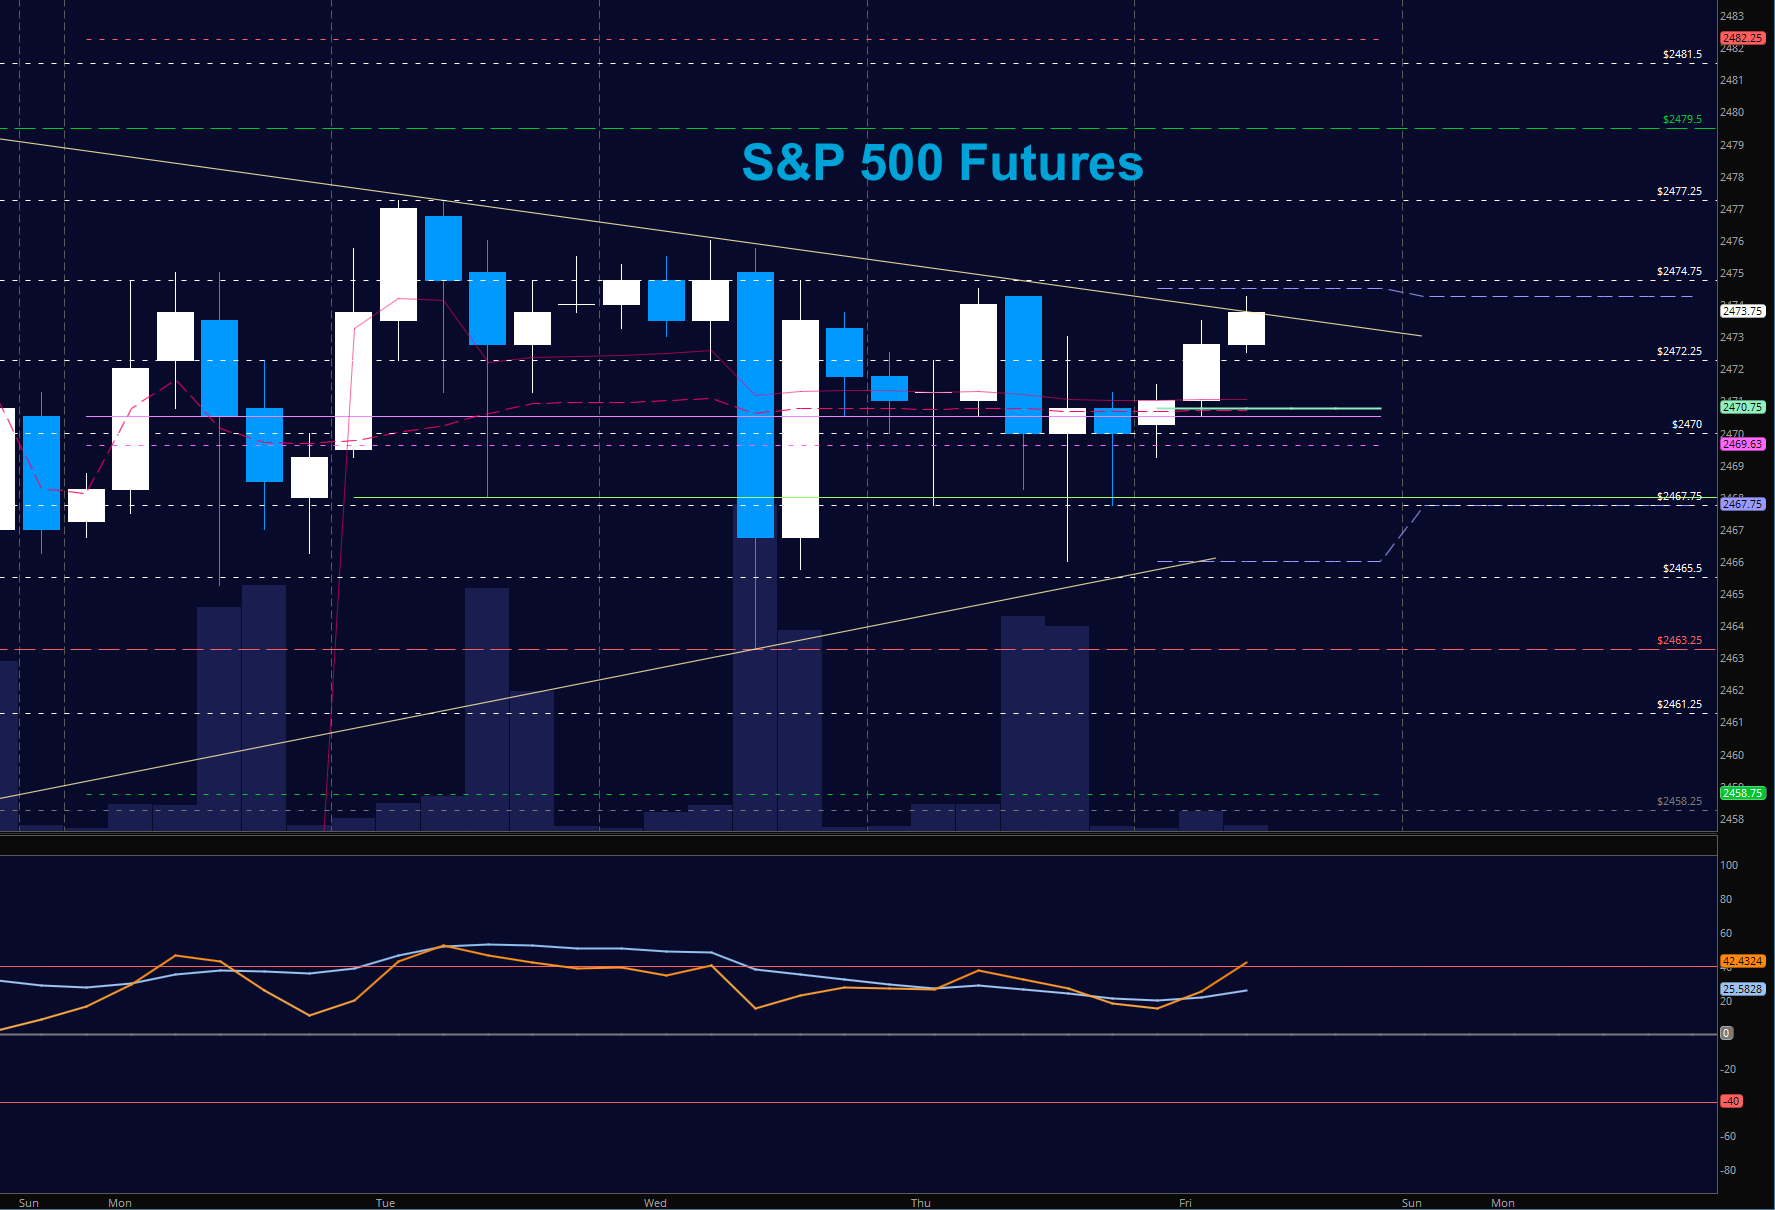
S&P 500 (ES)
Initial price support sits near 2474.75 , while resistance is still near 2478 as we are relatively range bound. Watch for the FAILED RETEST of 2467.75 for buyers to jump ship. The bullets below represent the likely shift of trading momentum at the positive or failed retests at the levels noted.
- Buying pressure intradaywill likely strengthen above a positive retest of 2476 (careful again here with resistance)
- Sellingpressure intraday will likely strengthen with a failed retest of 2467
- Resistance sits near 2476 to 2477.75, with 2480.75 and 2483.75 above that
- Support holds between 2470.5 and 2467, with 2463.5 and 2458.75 below that.
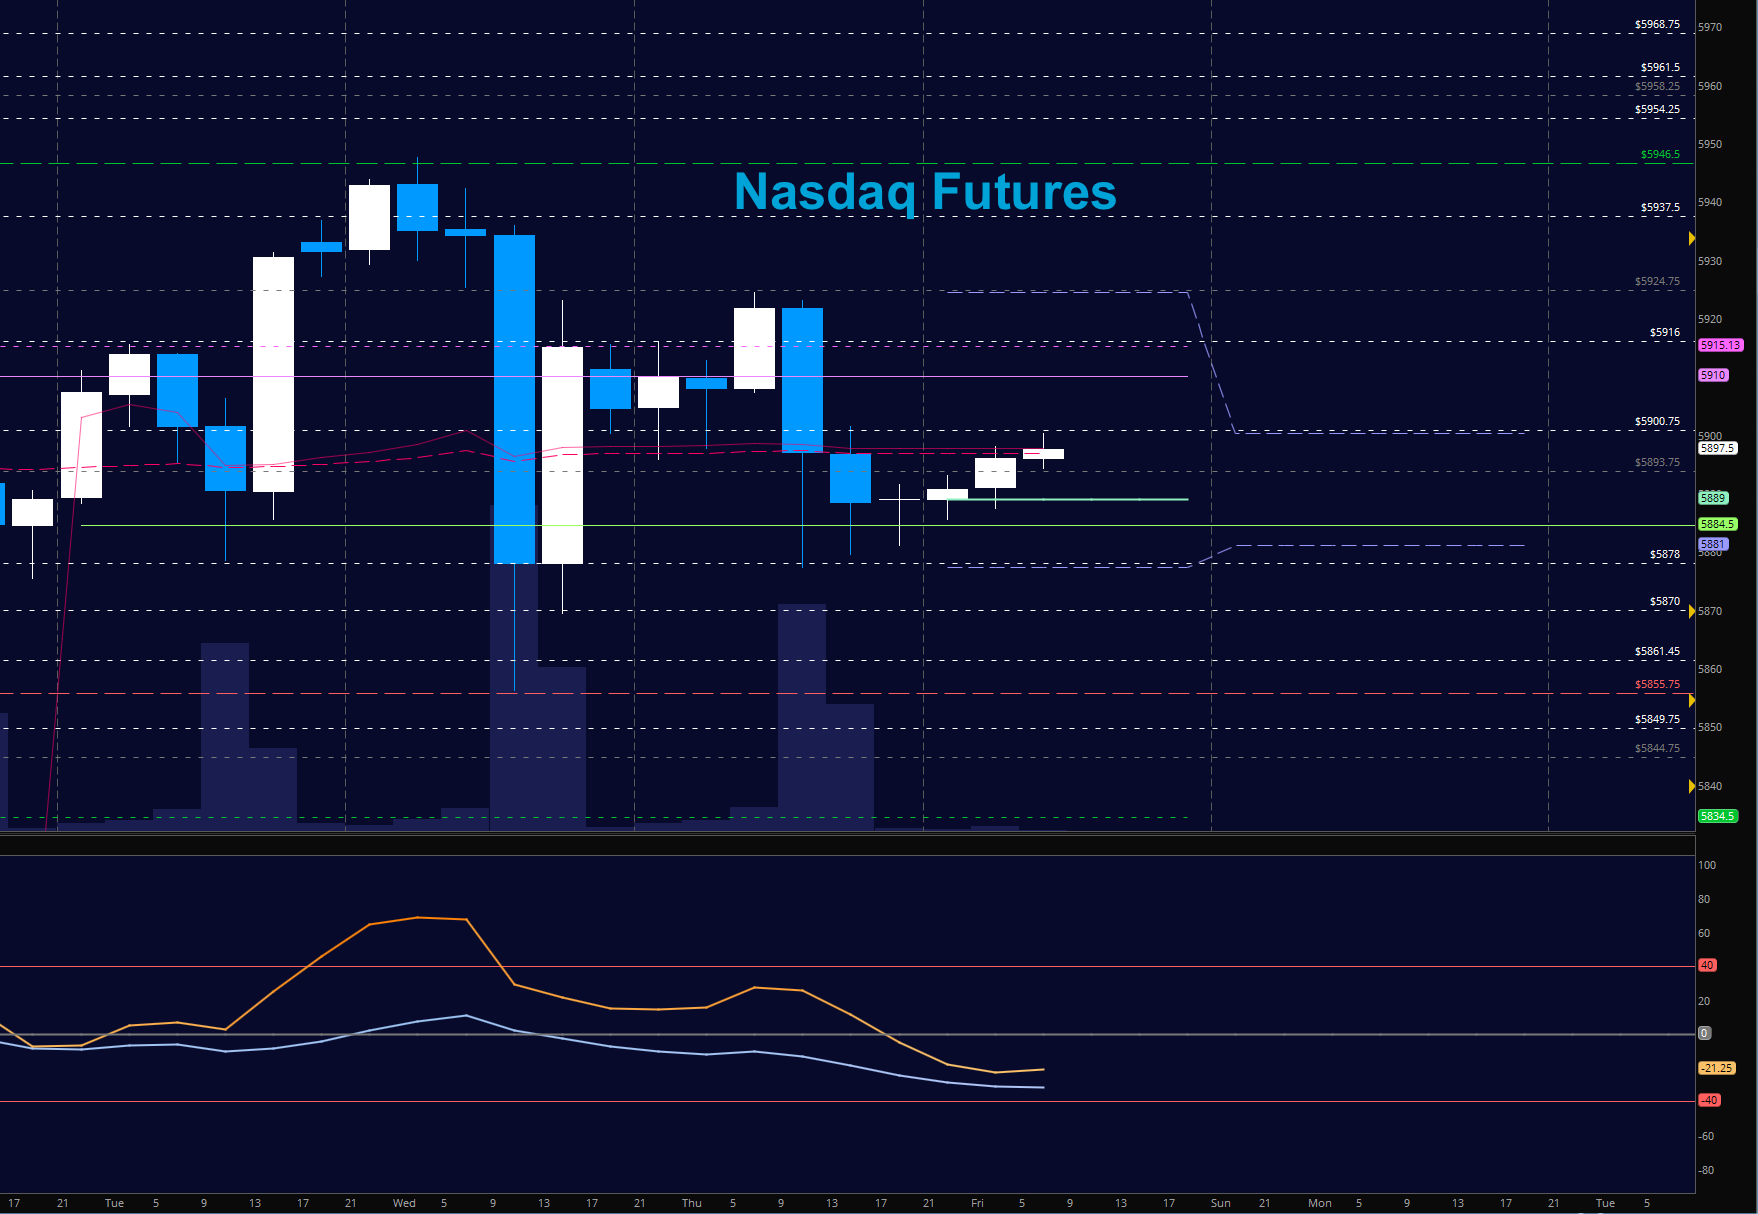
NASDAQ Futures (NQ)
Tech continues to show weakness relative to other charts. Resistance sits lower near 5900.75 and then above at 5924.75. Support regions sit near 5887-5877. Momentum remains mixed but charting a bit lower in general. Watch for resolution of price above 5919 to shift the balance between buyers and sellers. The bullets below represent the likely shift of intraday trading momentum at the positive or failed tests at the levels noted.
- Buyingpressure intraday will likely strengthen with a positive retest of 5919
- Sellingpressure intraday will likely strengthen with a failed retest of 5877
- Resistance sits near 5919 to 5924, with 5936.75 and 5954.75 above that.
- Support holds between 5880.5 and 5875.5, with 5870.75 and 5861.5 below that.
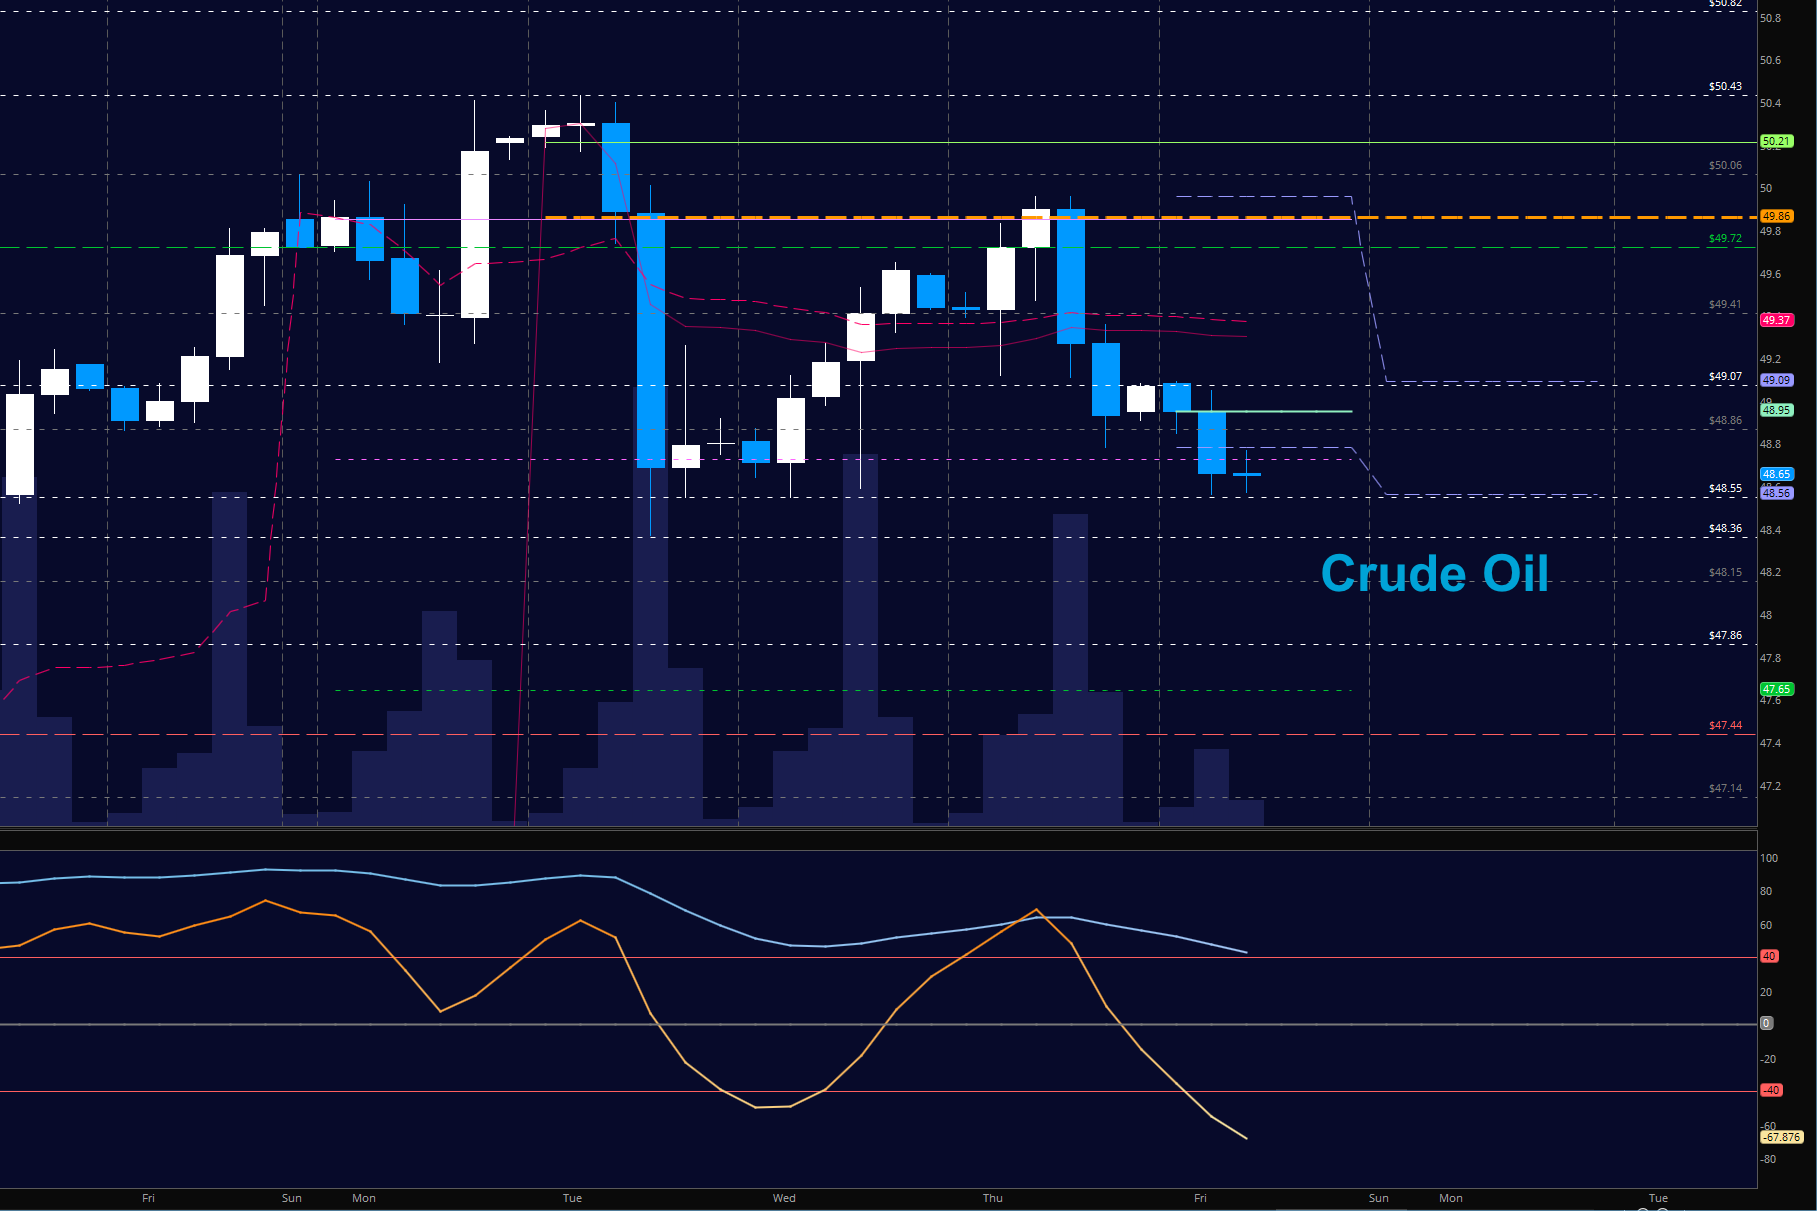
WTI Crude Oil
Buyers bounce off support near 48.55 and are trying to recapture old support at 49.1 – now sitting as new resistance. Deep pullbacks will continue to hold regions for buyers to engage in the current formation. Momentum is mixed so the key to future motion will be measuring how much resistance sits between 49.1 and 46.4. Below 49.1, we are likely to see 48.86, 48.55 and 48.34. The bullets below represent the likely shift of trading momentum at the positive or failed tests at the levels noted.
- Buyingpressure intraday will likely strengthen with a positive retest of 49.46
- Sellingpressure intraday will strengthen with a failed retest of 48.34
- Resistance sits near 49.43 to 49.88, with 50.06 and 50.43 above that.
- Support holds between 48.5 to 48.35, with 48.15 and 47.86 below that.
If you’re interested in watching these trades go live, join us in the live trading room from 9am to 11:30am each trading day. Visit TheTradingBook for more information.
If you’re interested in the live trading room, it is now primarily stock market futures content, though we do track heavily traded stocks and their likely daily trajectories as well – we begin at 9am with a morning report and likely chart movements along with trade setups for the day.
As long as the trader keeps himself aware of support and resistance levels, risk can be very adequately managed to play in either direction as bottom picking remains a behavior pattern that is developing with value buyers and speculative traders.
Twitter: @AnneMarieTrades
The author trades stock market futures every day and may have a position in mentioned securities at the time of publication. Any opinions expressed herein are solely those of the author, and do not in any way represent the views or opinions of any other person or entity.


