Stock Market Considerations For April 7, 2017
Reactions to NFP can cause gyrations near-term. The big question is always after the fact: Is there significant weight for continuation in either direction? My suspicion is no based on general intraday momentum readings on the S&P 500 (INDEXSP:.INX).
Check out today’s economic calendar with a full rundown of releases. And note that the charts below are from our premium service at The Trading Book and are shared exclusively with See It Market readers.
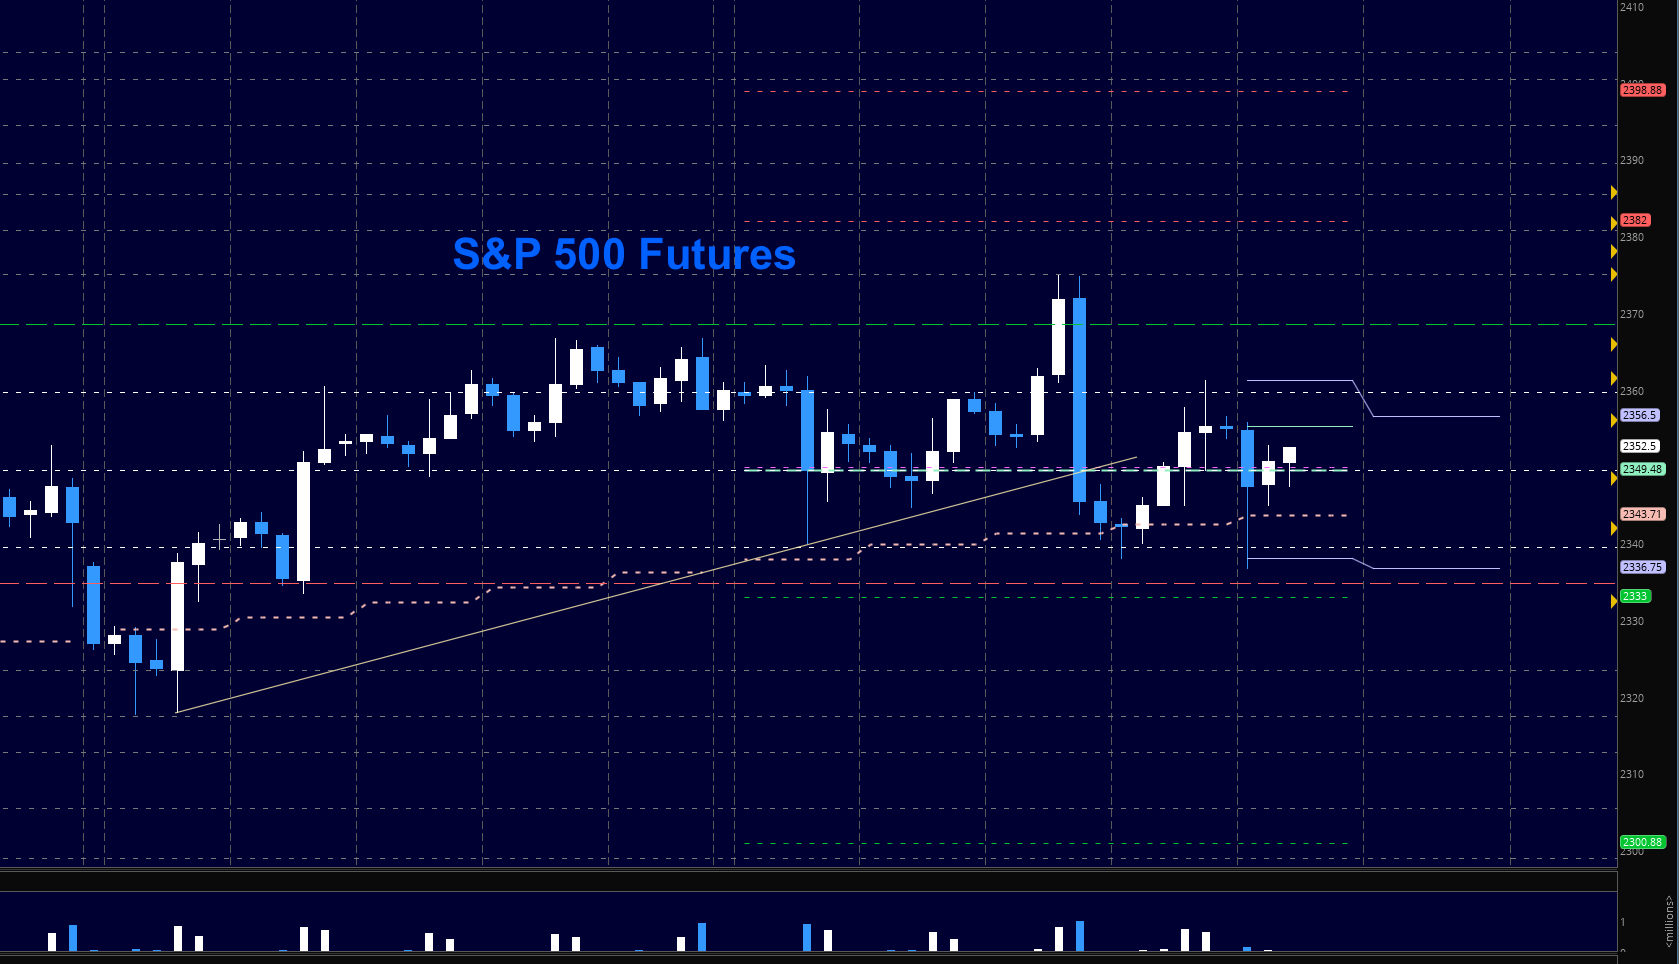
S&P 500 Futures (ES)
With a good number, we could also dip as FOMC warnings of an overheated market roiled the space a few days ago. If you are not experienced (that means novice or inconsistent experience), it is best to wait for the dust to settle before engaging. The support level near 2349 remains extremely important.
- Buying pressure will likely strengthen above a positive retest of 2359.75 (but more resistance is ahead nearby)
- Selling pressure will likely strengthen with a failed retest of 2339
- Resistance sits near 2359.75 to 2363.5, with 2369.5 and 2376.25 above that
- Support holds between 2339 and 2334.5, with 2323.5 and 2317.5 below that
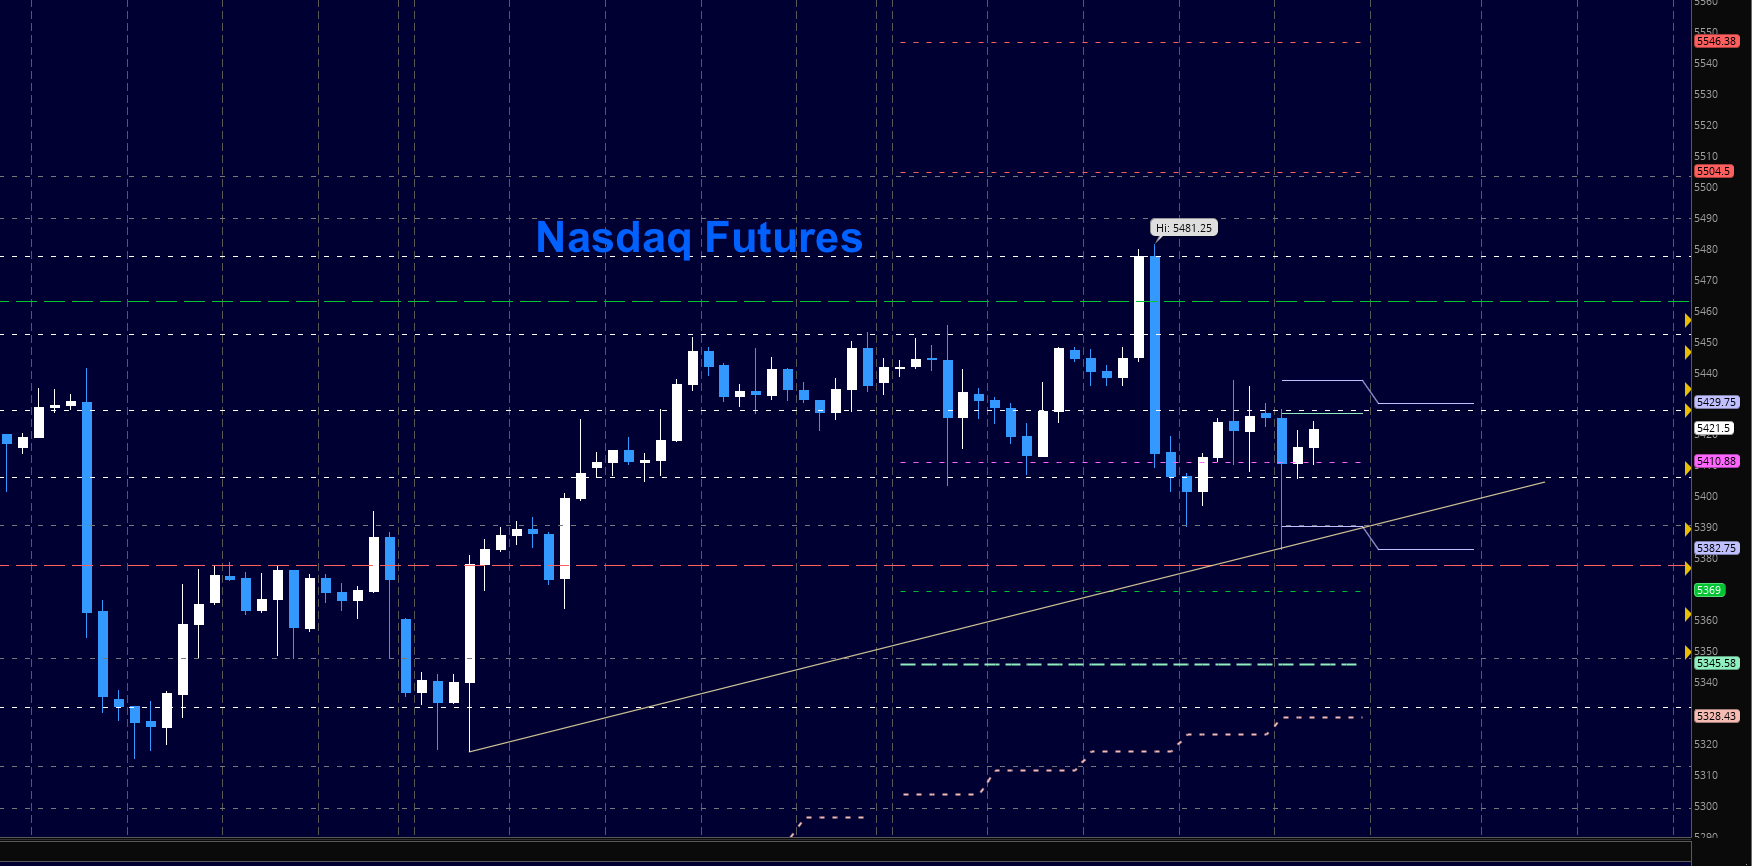
NASDAQ Futures
Momentum drifted lower yesterday as the NQ_F presented the lower high as expected. Overnight, we broke the low but quickly recovered and is also moving around congestion levels near 5420. Candles are likely to hold long wicks today as well, as spikes in either direction may not hold. We have lower momentum, so rejections of higher levels could provide excellent shorts for the intraday trader. New support levels to watch are in the 5370 region. Use caution trading at the edges today.
- Buying pressure will likely strengthen with a positive retest of 5446 (use caution as sellers sit up here-wait for a retest)
- Selling pressure will likely strengthen with a failed retest of 5406
- Resistance sits near 5456 to 5462.75, with 5477.25 and 5489.5 above that
- Support holds between 5388.5 and 5380.5, with 5377.5 and 5347.5 below that
Crude Oil –WTI
A big pop in oil took us to the edge of our resistance levels noted, and indeed, breached before rejecting. If the chart holds and/or recovers 52.17, we will press further into 53.19. Support holds below at 51.2, but we could see some big action depending on the weight of markets. Buyers are battling at a new higher low near 52.17, and a fade there should give us the retest of 51.7. Momentum is high. Rig count is out this afternoon.
- Buying pressure will likely strengthen with a positive retest of 52.7
- Selling pressure will strengthen with a failed retest of 51.2
- Resistance sits near 52.7 to 53.2, with 53.76 and 54.38 above that.
- Support holds between 51.2 and 50.77, with 50.47 and 50.06 below that.

If you’re interested in watching these trades go live, join us in the live trading room from 9am to 11:30am each trading day. Visit TheTradingBook for more information.
Our live trading room is now primarily stock market futures content, though we do track heavily traded stocks and their likely daily trajectories as well – we begin at 9am with a morning report and likely chart movements along with trade setups for the day.
As long as the trader keeps himself aware of support and resistance levels, risk can be very adequately managed to play in either direction as bottom picking remains a behavior pattern that is developing with value buyers and speculative traders.
Twitter: @AnneMarieTrades
The author trades stock market futures every day and may have a position in mentioned securities at the time of publication. Any opinions expressed herein are solely those of the author, and do not in any way represent the views or opinions of any other person or entity.


