Stock Market Futures Trading Considerations For Feb 7, 2017
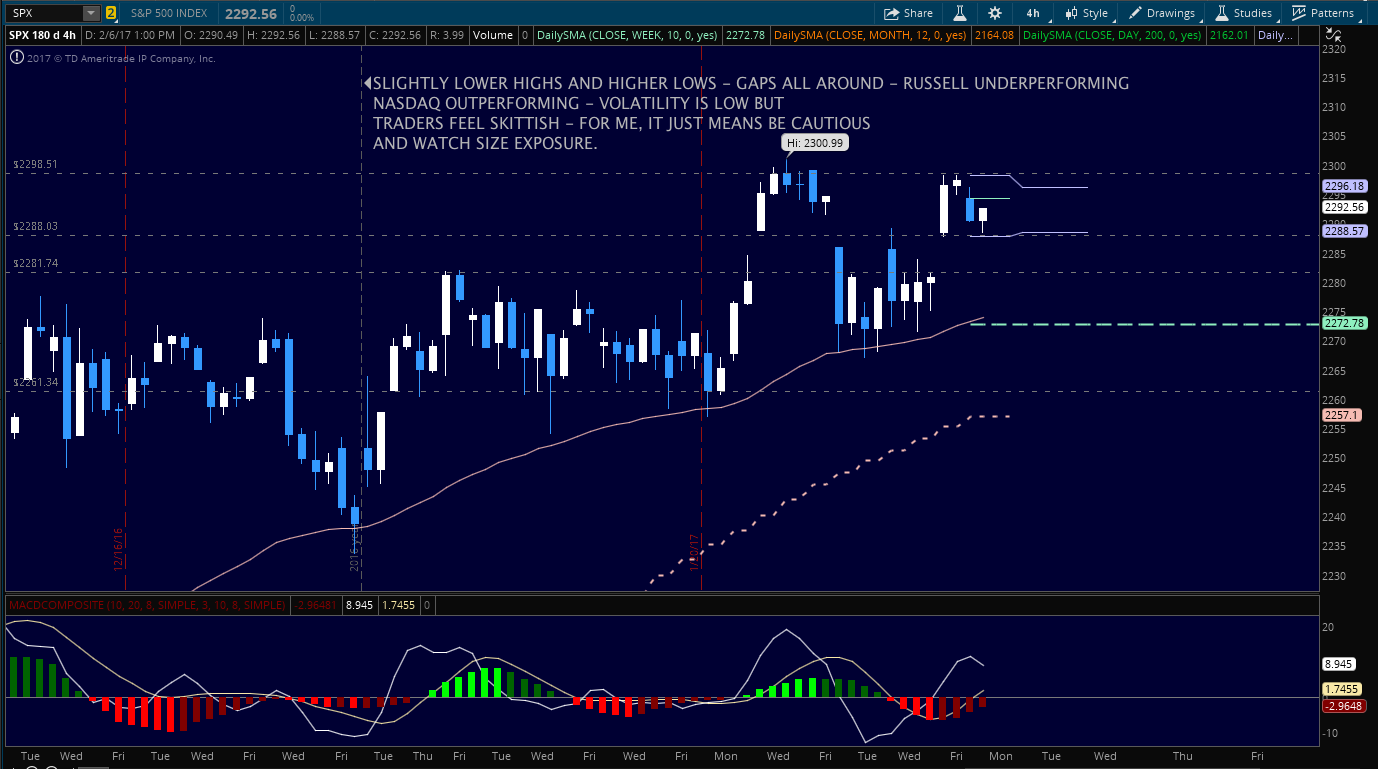
S&P 500 futures are testing 2294 for the third day in a row with somewhat mixed momentum.
Market pullbacks at first pass will likely find buyers as they did yesterday. Sellers are likely to have trouble unless they are willing to exit trades at clean support. Key support levels look like 2286.5, then 2281. On the upside, we see 2294.25 and 2297.25.
Buying pressure will likely strengthen above a positive retest of 2294, while selling pressure will strengthen with a failed retest of 2283.
Price resistance sits near 2294.5 to 2297.5, with 2299.5 and 2302.5 above that. Price support holds between 2286.75 and 2283, with 2279.75 and 2275 below that
See today’s economic calendar with a rundown of releases.
TODAY’S RANGE OF MOTION
E-mini S&P 500 Futures Trading Outlook For February 7
Upside trades – Two options for entry
- Positive retest of continuation level -2294.25( watch for sellers near 2297.25)
- Positive retest of support level– 2284.75 ( watch also for sellers near 2289.25)
- Opening targets ranges – 2289.25, 2294.25, 2297.25, 2299.5, 2301.75, 2303.5, 2306.75, 2309.75, 2313.5 and 2320
Downside trades – Two options for entry
- Failed retest of resistance level -2292
- Failed retest of support level– 2289.25
- Opening target ranges – 2289.5, 2283.25, 2279.75, 2276.25, 2274.25, 2272.25, 2269.5, 2264.5, 2260.5, 2256, 2253.5 and 2249.75
Nasdaq Futures
The NQ_F resumed its bullish trend and broke out of the upper trend line to test all time highs before retreating from these new highs. Pullbacks are still likely to be bought in these up trends and we are seeing bigger targets to the north as the higher lows hold. There is still a rising wedge in play.
Buying pressure will likely strengthen with a positive retest of 5173, while selling pressure will strengthen with a failed retest of 5145.5. Price resistance sits near 5173 to 5178.5, with 5181 and 5183.5 above that. Price support holds between 5145.5 and 5140.5, with 5137.5 and 5131.5 below that
Upside trades – Two options
- Positive retest of continuation level -5172.5
- Positive retest of support level– 5149.5
- Opening target ranges – 5151.5, 5158.75, 5161.5, 5167.5, 5173.5, 5178.75, 5183.5, and 5188.25
Downside trades- Two options
- Failed retest of resistance level -5167.5
- Failed retest of support level– 5160.5
- Opening target ranges –5160.75, 5157.25, 5154.5, 5151.5, 5145.5, 5140.5, 5137.5, 5133.25, 5128.5, 5123.75, 5119.75, 5113.25, 5106.5, 5102.5, 5097.75, 5094.5, 5083, 5075.75, 5070.5, 5064 and 5058
Crude Oil –WTI
The weight of supply continues to weigh heavy on the charts here. We are nearing the bottom of the channel where we have seen value events for buyers in the past. There may be a sea change on the horizon but we must anticipate the obvious first and prepare for the potential for failure of prices to hold if a reversal is underway. The API report is released after the closed.
Buying pressure will likely strengthen with a positive retest of 53.86, while selling pressure will strengthen with a failed retest of 52.30. Price resistance sits near 54.04 to 54.34, with 54.81 and 55.03 above that. Price support holds between 52.3 and 52.03, with 51.78 and 51.52 below that.
Upside trades – Two options
- Positive retest of continuation level -53.05
- Positive retest of support level– 52.66
- Opening target ranges –52.86, 53.09, 53.34, 53.6, 53.86, 54.02, 54.19, 54.3, 54.51, 54.76, 55.02, 55.19, and 55.35
Downside trades- Two options
- Failed retest of resistance level -53.22
- Failed retest of support level– 52.6
- Opening target ranges – 53.04, 52.86, 52.66, 52.34, 52.08, 51.78, 51.52, 51.24, 51.04, 50.82, 50.47, 50.3, and 50.16
If you’re interested in the live trading room, it is now primarily stock market futures content, though we do track heavily traded stocks and their likely daily trajectories as well – we begin at 9am with a morning report and likely chart movements along with trade setups for the day.
As long as the trader keeps himself aware of support and resistance levels, risk can be very adequately managed to play in either direction as bottom picking remains a behavior pattern that is developing with value buyers and speculative traders.
Twitter: @AnneMarieTrades
The author trades stock market futures every day and may have a position in mentioned securities at the time of publication. Any opinions expressed herein are solely those of the author, and do not in any way represent the views or opinions of any other person or entity.


