Stock Market Futures Trading Considerations For February 6, 2017
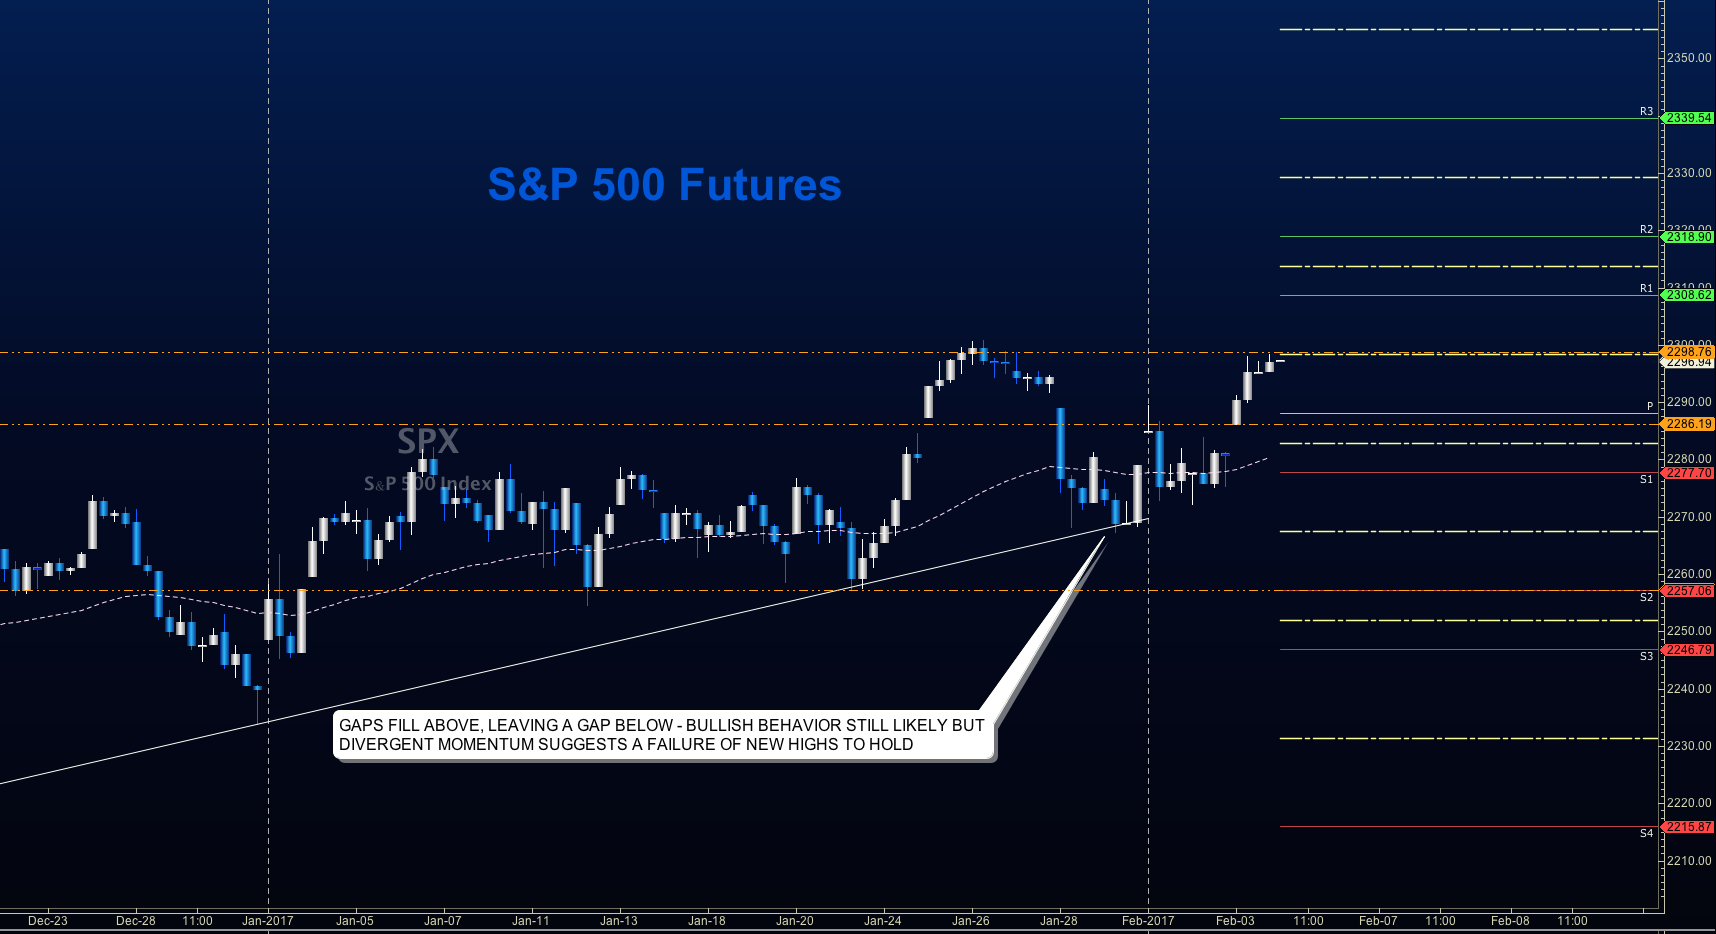
Weak momentum to the upside early today is giving way to some early selling premarket. Pullbacks on the S&P 500 (INDEXSP:.INX) at first pass will find buyers but there is a drift that may be setting up lower. Failed retests will be key to watching motion. Key support levels look like 2286.5, then 2281. On the upside, we see 2294.25 and 2297.25.
Buying pressure will likely strengthen above a positive retest of 2295, while selling pressure will strengthen with a failed retest of 2286.5.
Price resistance sits near 2294.5 to 2297.5, with 2299.5 and 2302.5 above that. Price support holds between 2286.75 and 2283, with 2279.75 and 2275 below that
See today’s economic calendar with a rundown of releases.
TODAY’S RANGE OF MOTION
E-mini S&P 500 Futures Trading Outlook For February 6
Upside trades – Two options for entry
- Positive retest of continuation level -2294.25( watch for sellers near 2297.25)
- Positive retest of support level– 2286.75 ( watch also for sellers near 2289.25)
- Opening targets ranges – 2289.25, 2294.25, 2297.25, 2299.5, 2301.75, 2303.5, 2306.75, 2309.75, 2313.5 and 2320
Downside trades – Two options for entry
- Failed retest of resistance level -2292
- Failed retest of support level– 2289.25
- Opening target ranges – 2289.5, 2283.25, 2279.75, 2276.25, 2274.25, 2272.25, 2269.5, 2264.5, 2260.5, 2256, 2253.5 and 2249.75
Nasdaq Futures
The NQ_F is still caught in a wedge of tightening action as momentum continues to dampen. The bigger picture is still bullish but a range bound formation has the chart holding the pattern. Failed retests will tell the tale here also.
- Buying pressure will likely strengthen with a positive retest of 5161.75
- Selling pressure will strengthen with a failed retest of 5140.5
- Resistance sits near 5161.5 to 5165.5, with 5168.5 and 5173.5 above that
- Support holds between 5140 and 5131.5, with 5128.5 and 5123.5 below that
Upside trades – Two options
- Positive retest of continuation level -5161.5
- Positive retest of support level– 5140.5
- Opening target ranges – 5130.75, 5135.5, 5140.5, 5145.5, 5151.5, 5158.75, 5161.5, 5167.5, 5173.5, 5178.75, 5183.5, and 5188.25
Downside trades- Two options
- Failed retest of resistance level -5154.5
- Failed retest of support level– 5138.5
- Opening target ranges – 5151.5, 5145.5, 5140.5, 5137.5, 5133.25, 5128.5, 5123.75, 5119.75, 5113.25, 5106.5, 5102.5, 5097.75, 5094.5, 5083, 5075.75, 5070.5, 5064 and 5058
Crude Oil –WTI
Lower highs and poor earnings reports across the major oil spaces might drag these down, but bullish weight still holds here on the chart. We have the chance of deeps lower into the base of the channel. Levels from Friday hold steady
- Buying pressure will likely strengthen with a positive retest of 54.15
- Selling pressure will strengthen with a failed retest of 53.3
- Resistance sits near 54.34 to 54.51, with 54.81 and 55.03 above that.
- Support holds between 53.6 and 53.3, with 52.86 and 52.66 below that.
Upside trades – Two options
- Positive retest of continuation level -54.05 ( watch for sellers near 54.19)
- Positive retest of support level– 53.64 (watch for sellers near 53.86)
- Opening target ranges –53.86, 54.02, 54.19, 54.3, 54.51, 54.76, 55.02, 55.19, and 55.35
Downside trades- Two options
- Failed retest of resistance level -53.8 ( watch for buyers near 53.54 and 53.35)
- Failed retest of support level– 53.52 (watch for buyers near 53.35)
- Opening target ranges – 53.67, 53.48, 53.3, 53.04, 52.86, 52.66, 52.34, 52.08, 51.78, 51.52, 51.24, 51.04, 50.82, 50.47, 50.3, and 50.16
If you’re interested in watching these trades go live, join us in the live trading room from 9am to 11:30am each trading day.
Visit TheTradingBook for more information.
If you’re interested in the live trading room, it is now primarily stock market futures content, though we do track heavily traded stocks and their likely daily trajectories as well – we begin at 9am with a morning report and likely chart movements along with trade setups for the day.
As long as the trader keeps himself aware of support and resistance levels, risk can be very adequately managed to play in either direction as bottom picking remains a behavior pattern that is developing with value buyers and speculative traders.
Twitter: @AnneMarieTrades
The author trades stock market futures every day and may have a position in mentioned securities at the time of publication. Any opinions expressed herein are solely those of the author, and do not in any way represent the views or opinions of any other person or entity.


: Showing Some Signs of Emerging Strength")
