Stock Market Futures Trading Considerations For February 2, 2017
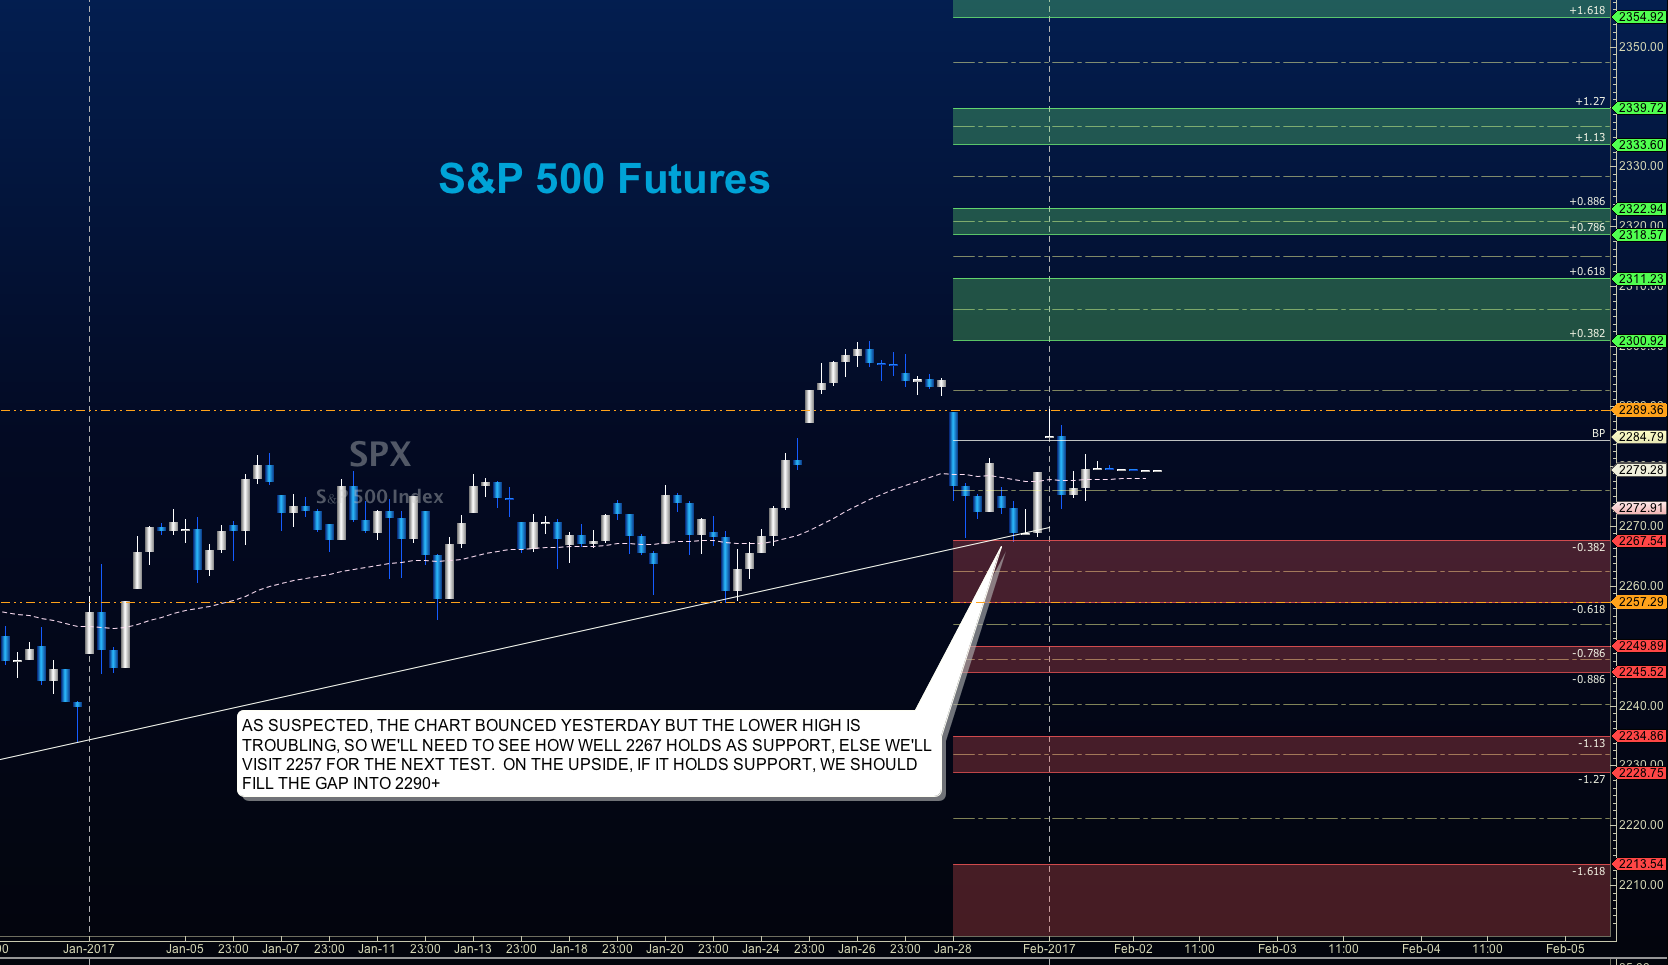
The S&P 500 (INDEXSP:.INX) may be setting up for an inside day, but that doesn’t mean we should not prepare for breaks on either side. Lower highs and higher lows have been forming on S&P 500 futures. Sellers will position themselves near 2281, and buyers will position near 2262.25. Trader behavior at these levels will tell the tale as the day advances. Selling at price resistance and buying price support have been the patterns that hold but gains continue to tighten as the ranges from high to low do the same. Caution ahead.
Buying pressure will likely strengthen above a positive retest of 2284, while selling pressure will strengthen with a failed retest of 2262.25.
Price resistance sits near 2281.5 to 2284.5, with 2287.5 and 2294.75 above that. Price support holds between 2264.5 and 2262.25, with 2257.75 and 2254 below that
See today’s economic calendar with a rundown of releases.
TODAY’S RANGE OF MOTION
E-mini S&P 500 Futures Trading For February 2
- Positive retest of continuation level -2275.25( watch for sellers near 2277.75)
- Positive retest of support level– 2270.5 ( watch also for sellers near 2275.25)
- Opening targets ranges -22705, 2275, 2277.75, 2281.5, 2284.25, 2287.5, 2290.75, 2294.25, 2297.25, 2299.5, 2301.75, 2303.5, 2306.75, 2309.75, 2313.5 and 2320
Downside trades – Two options for entry
- Failed retest of resistance level -2281
- Failed retest of support level– 2274.25
- Opening target ranges – 2277.5, 2274.25, 2270.5, 2268, 2264.5, 2260.5, 2256, 2253.5 and 2249.75
Nasdaq Futures
The NQ_F is building higher lows and lower highs, as both AAPL and FB did well with their earnings releases. Fades will still likely to be deemed as buy zones for this chart in particular. The gap fill on this outperforming chart may be on the horizon here but momentum suggests that moves upward should also meet sellers and create candle wicks.
- Buying pressure will likely strengthen with a positive retest of 5142.75
- Selling pressure will strengthen with a failed retest of 5106.75
- Resistance sits near 5142.75 to 5148, with 5151.5 and 5161.5 above that
- Support holds between 5106.75 and 5094.5, with 5083 and 5064.5 below that
Upside trades – Two options
- Positive retest of continuation level -5132.25
- Positive retest of support level– 5123.75
- Opening target ranges – 5111, 5117.75, 5124.75, 5135.5, 5142, 5148, 5151.5, 5158.75, 5161.5, 5167.5, 5173.5, 5178.75, 5183.5, and 5188.25
Downside trades- Two options
- Failed retest of resistance level -5146.5
- Failed retest of support level– 5123.75
- Opening target ranges –5142.75, 5136.25, 5132.75, 5127.5, 5123.75, 5117.75, 5113.75, 5109.5, 5103.75, 5098.7, 5094.5, 5083, 5075.75, 5070.5, 5064 and 5058
Crude Oil –WTI
The EIA report showed a larger than anticipated build as well, but prices have continued upward as hedge funds as net long and betting on the OPEC production dips will likely keep prices higher. We hit a major target this morning near 54.3, and we should see some selling up here. The lower highs that might build might could give us a clue as to further direction.
- Buying pressure will likely strengthen with a positive retest of 54.1
- Selling pressure will strengthen with a failed retest of 53.48
- Resistance sits near 54.3 to 54.54, with 54.81 and 55.03 above that.
- Support holds between 53.64 and 53.49, with 53.36 and 53.01 below that.
Upside trades – Two options
- Positive retest of continuation level -53.88 ( watch for sellers near 54.03 and 54.19)
- Positive retest of support level– 53.67 (watch for sellers near 53.67 and 53.83)
- Opening target ranges –53.86, 54.16, 54.3, 54.51, 54.76, 55.02, 55.19, and 55.35
Downside trades- Two options
- Failed retest of resistance level -53.8 ( watch for buyers near 53.54 and 53.35)
- Failed retest of support level– 53.44 (watch for buyers near 53.35)
- Opening target ranges –53.67, 53.46, 53.3, 53.04, 52.86, 52.66, 52.34, 52.08, 51.78, 51.52, 51.24, 51.04, 50.82, 50.47, 50.3, and 50.16
If you’re interested in the live trading room, it is now primarily stock market futures content, though we do track heavily traded stocks and their likely daily trajectories as well – we begin at 9am with a morning report and likely chart movements along with trade setups for the day.
As long as the trader keeps himself aware of support and resistance levels, risk can be very adequately managed to play in either direction as bottom picking remains a behavior pattern that is developing with value buyers and speculative traders.
Twitter: @AnneMarieTrades
The author trades stock market futures every day and may have a position in mentioned securities at the time of publication. Any opinions expressed herein are solely those of the author, and do not in any way represent the views or opinions of any other person or entity.


