Stock Market Futures Considerations For February 1, 2017
As the FOMC meeting draws to a close, no rate hikes are predicted until after the June meeting (which is a bit far off in my mind so those probabilities may change). The S&P 500 (INDEXSP:.INX) seems to have caught hold of support and bounced back into resistance areas once more so it is likely that the pullbacks will still bring buyers to the forefront. The news flow continues to roil hearts and minds across the board so I suspect the mental conflict in traders (in general) will bleed into the charts, and dips may be harder to hold and run a bit deeper as time progresses through the month. That said, pricing behavior remains bullish.
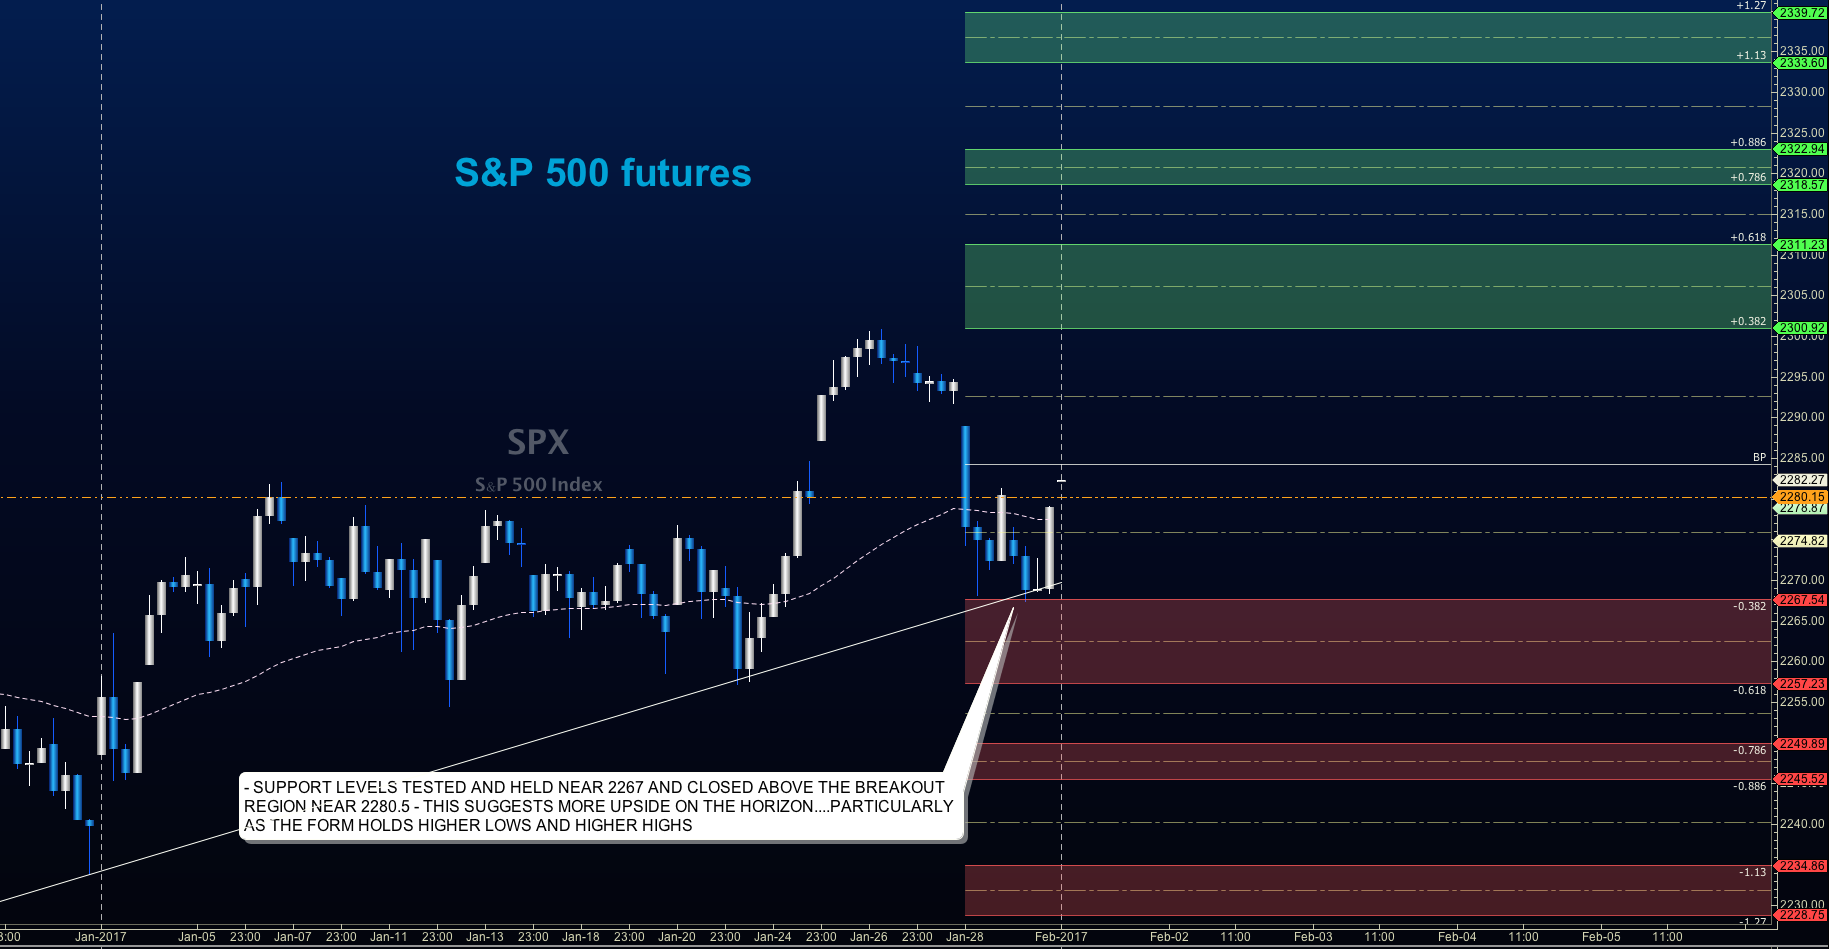
Buying pressure will likely strengthen above a positive retest of 2281.5 but resistance lies ahead, while selling pressure will strengthen with a failed retest of 2267.5.
Price resistance sits near 2281.5 to 2284.5, with 2287.5 and 2294.75 above that. Price support holds between 2271.5 and 2262.25, with 2260.5 and 2256.75 below that
See today’s economic calendar with a rundown of releases.
TODAY’S RANGE OF MOTION
E-mini S&P 500 Futures Trading For January 31
Upside trades – Two options for entry
- Positive retest of continuation level -2281.5( watch for sellers near 2284.25)
- Positive retest of support level– 2275 ( watch also for sellers near 2277.25)
- Opening targets ranges -2277, 2281, 2284.25, 2287.5, 2290.75, 2294.25, 2297.25, 2299.5, 2301.75, 2303.5, 2306.75, 2309.75, 2313.5 and 2320
Downside trades – Two options for entry
- Failed retest of resistance level -2281
- Failed retest of support level– 2274.25
- Opening target ranges – 2277.5, 2274.25, 2270.5, 2268, 2264.5, 2260.5, 2256, 2253.5 and 2249.75
Nasdaq Futures
The NQ_F holds above its major breakout patterns this morning but sits near resistance that should retrace into higher lows. AAPL reported and holds nicely above its close. Fades are likely to be buy zones for this chart in particular.
Buying pressure will likely strengthen with a positive retest of 5142.75, while selling pressure will strengthen with a failed retest of 5106.75. Price resistance sits near 5142.75 to 5148, with 5151.5 and 5161.5 above that. Price support holds between 5106.75 and 5094.5, with 5083 and 5064.5 below that
Upside trades – Two options
- Positive retest of continuation level -5132.25
- Positive retest of support level– 5123.75
- Opening target ranges – 5111, 5117.75, 5124.75, 5135.5, 5142, 5148, 5151.5, 5158.75, 5161.5, 5167.5, 5173.5, 5178.75, 5183.5, and 5188.25
Downside trades- Two options
- Failed retest of resistance level -5146.5
- Failed retest of support level– 5123.75
- Opening target ranges –5142.75, 5136.25, 5132.75, 5127.5, 5123.75, 5117.75, 5113.75, 5109.5, 5103.75, 5098.7, 5094.5, 5083, 5075.75, 5070.5, 5064 and 5058
Crude Oil –WTI
The API report showed a larger than anticipated build but prices have held steady in the current channel still bounded by 53.87 on the upside and 52.09 on the downside. Trading the edges of this formation have held for some time. When forms hold this long, they become more dangerous to trade at the edges each time. Use caution with size and allow confirmation to drive your decisions. The EIA report is out at 10:30 am ET today.
Buying pressure will likely strengthen with a positive retest of 53.47, while selling pressure will strengthen with a failed retest of 52.06. Price resistance sits near 53.67 to 54.06, with 54.28 and 54.51 above that. Price support holds between 52.23 and 52.06, with 51.78 and 50.80 below that.
Upside trades – Two options
- Positive retest of continuation level -53.09 ( watch for sellers near 53.23 and 53.47)
- Positive retest of support level– 52.81 (watch for sellers near 53.06 and 53.2)
- Opening target ranges – 52.93, 53.06, 53.23, 53.46, 53.86, 54.16, 54.28, 54.51, 54.76, 55.06, and 55.24
Downside trades- Two options
- Failed retest of resistance level -53.44 ( watch for buyers near 53.24 and 53.06)
- Failed retest of support level– 52.81 (watch for buyers near 52.66)
- Opening target ranges –53.23, 53.04, 52.66, 52.57, 52.28, 52.08, 51.78, 51.52, 51.24, 51.04, 50.82, 50.47, 50.3, and 50.16
If you’re interested in the live trading room, it is now primarily stock market futures content, though we do track heavily traded stocks and their likely daily trajectories as well – we begin at 9am with a morning report and likely chart movements along with trade setups for the day.
As long as the trader keeps himself aware of support and resistance levels, risk can be very adequately managed to play in either direction as bottom picking remains a behavior pattern that is developing with value buyers and speculative traders.
Twitter: @AnneMarieTrades
The author trades stock market futures every day and may have a position in mentioned securities at the time of publication. Any opinions expressed herein are solely those of the author, and do not in any way represent the views or opinions of any other person or entity.

: Showing Some Signs of Emerging Strength")
