Stock Market Outlook for December 6, 2016 – Can Buying Pressure Hold?
The battle continues in a contested region here for S&P 500 futures this morning. The news flow will keep us range bound (my thought, anyway) into next week’s FOMC announcement. It seems that an interest rate hike is baked in, and the only surprise might be if it is higher than expected. That seems like an outlier event but it could effect S&P 500 (INDEXSP:.INX) trade.
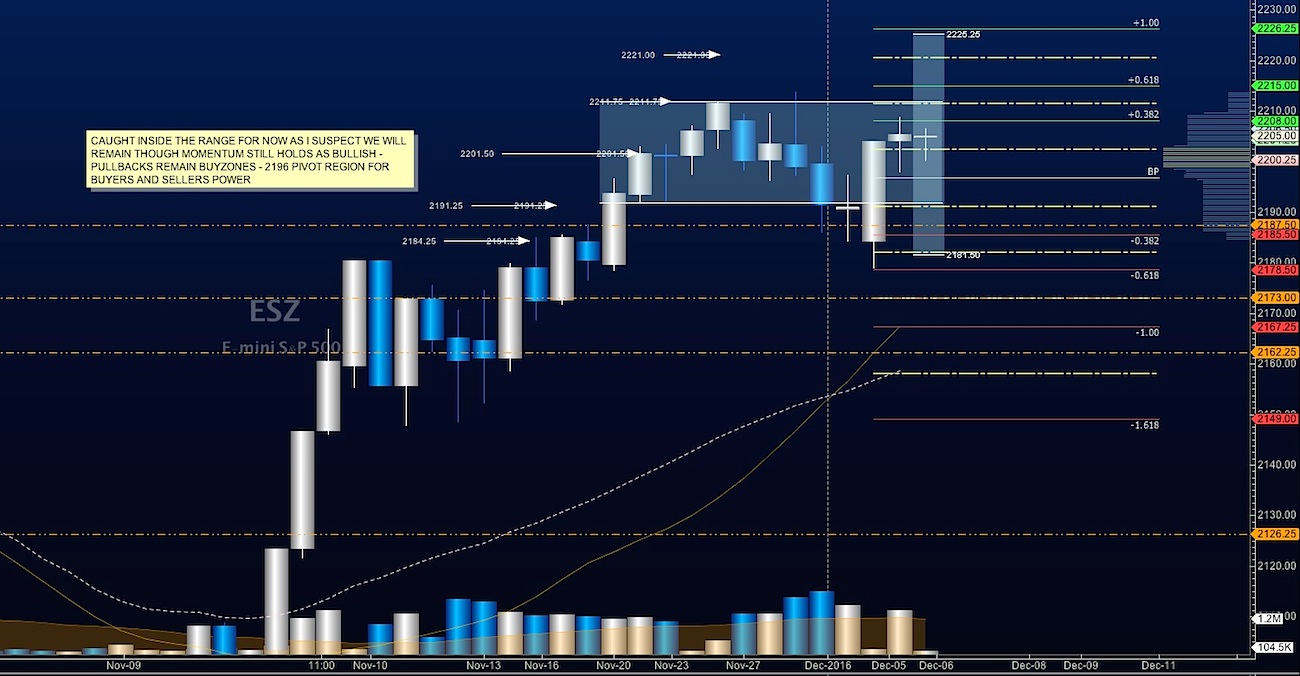
The line in the sand for S&P 500 futures buyers today will be near 2197-2196. Price support levels to watch below that level are 2187-2184. Price resistance is now prior support zones at 2208.75-2212.75. A breach over those levels means we are back to the upside breakout formation looking at 2223 and possibly higher. Stock market momentum is now bullish, but not increasing.
See today’s economic calendar with a rundown of releases.
TODAY’S RANGE OF MOTION
S&P 500 Futures Trading Chart – December 6
Upside trades – Two options for entry –
Positive retest of continuation level – 2204
Positive retest of support level – 2199
Opening targets ranges – 2200.75, 2203.75, 2206.75, 2210.75, 2213.50, AND 2216.50
Downside trades – Two options for entry –
Failed retest of resistance level – 2202
Failed retest of support level – 2197
Opening target ranges – 2200.5, 2197.75, 2195.75, 2192.25, 2187.75, 2184.25, 2181.50, 2179.50, and 2177.75
Nasdaq Futures
The NQ_F now has old resistance as new support near 4770-4776. The line in the sand today sits near 4760-4757 for buyers holding control of the chart. Pullbacks should also find buyers as momentum is positive and still increasing on the intraday cycles. Resistance still holds near 4806.50 to 4818.
Upside trades – Two options
Positive retest of continuation level – 4792.50
Positive retest of support level – 4768.50
Opening target ranges – 4772.25, 4775.50, 4790.50, 4805.75, 4811, and 4818.50
Downside trades – Two options
Failed retest of resistance level – 4805.50
Failed retest of support level – 4765
Opening target ranges – 4801.25, 4797.75, 4792.50, 4787.50, 4782.25, 4776.50, 4770.50, 4765.75, 4760.75, 4756.50, 4748.25, 4726.75, and 4717.75 if the chart continues to fade
WTI Crude Oil
A build in reserves, an OPEC deal without supervision of agreement, increased outputs and backwardation in the contract prices have us looking at prices that are holding levels that appear to be too high for the moment. I suspect that price continues to fade but I do not know how much weight is holding price action up here. We sit at the edges of resistance between 52.4 and 50.7. Support holds between 49.07 and 48.15.
Upside trades – Two options
Positive retest of continuation level – 52.02 (lots of sellers between 52.02 and 52.42)
Positive retest of support level – 50.74
Opening target ranges – 50.94, 51.35, 51.80, 51.97, 52.22, 52.4, 52.7, 53.03, and 53.54
Downside trades – Two options
Failed retest of resistance level – 51.8
Failed retest of support level – 50.7
Opening target ranges – 51.46, 51.18, 50.88, 50.25, 49.97, and 49.47
If you’re interested in watching these trades go live, join us in the live trading room from 9am to 11:30am each trading day. Further details and additional targets are in the Members Only portion of the blog.
Visit TheTradingBook.com for more information.
If you’re interested in the live trading room, it is now primarily futures content, though we do track heavily traded stocks and their likely daily trajectories as well – we begin at 9am with a morning report and likely chart movements along with trade setups for the day.
As long as the trader keeps himself aware of support and resistance levels, risk can be very adequately managed to play in either direction as bottom picking remains a behavior pattern that is developing with value buyers and speculative traders.
If you’re interested in the live trading room, it is now primarily stock market futures content, though we do track heavily traded stocks and their likely daily trajectories as well – we begin at 9am with a morning report and likely chart movements along with trade setups for the day.
As long as the trader keeps himself aware of support and resistance levels, risk can be very adequately managed to play in either direction as bottom picking remains a behavior pattern that is developing with value buyers and speculative traders.
Twitter: @AnneMarieTrades
The author trades stock market futures every day and may have a position in mentioned securities at the time of publication. Any opinions expressed herein are solely those of the author, and do not in any way represent the views or opinions of any other person or entity.

: Creating Bullish Divergence?")


: Creating Bullish Divergence?")

