December 23, 2016 Stock Market Outlook –
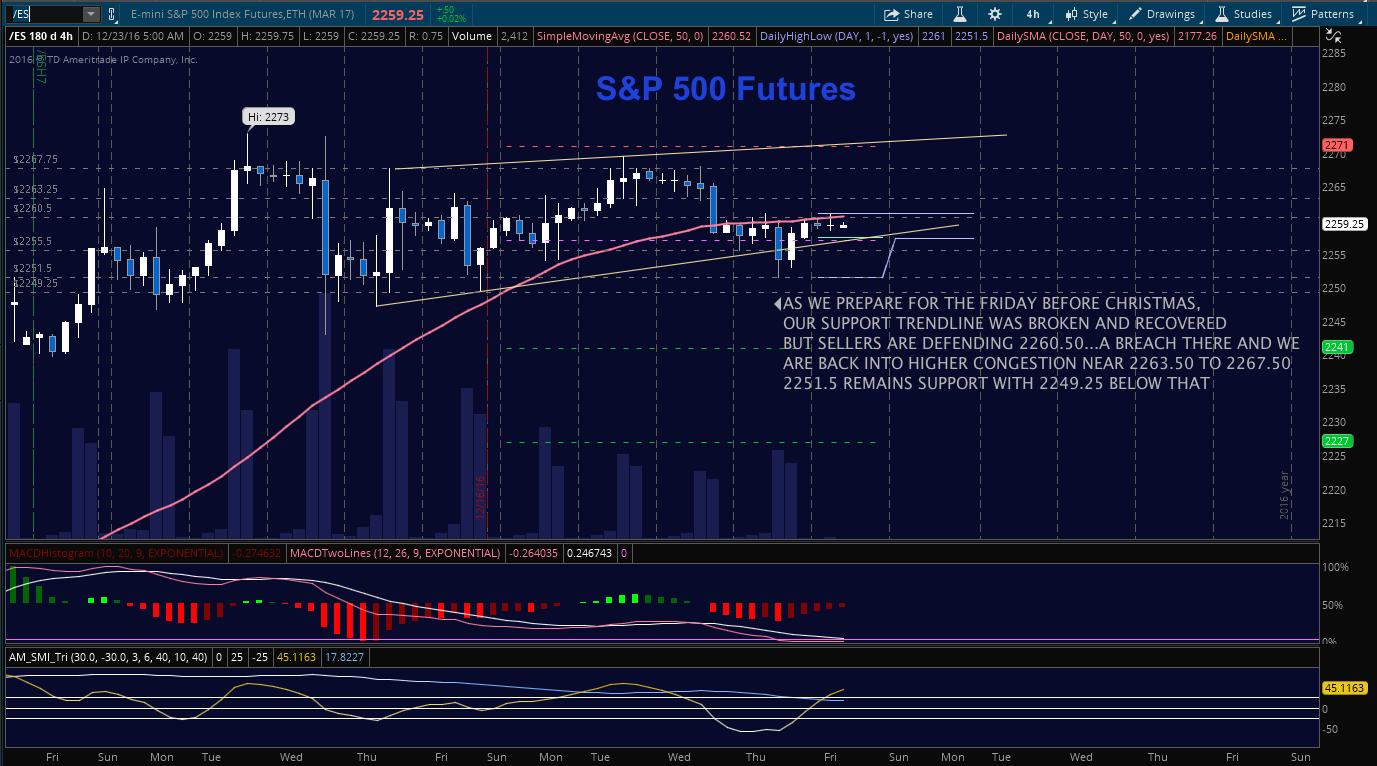
Note that the bond markets close at 2pm for the Christmas holiday today. The price action on the S&P 500 (INDEXSP:.INX) continues to tighten. Over on the futures chart, 2261 looks to be early resistance today. Buyers took advantage of a break of support and bought the “lower low” on a test of 2255.5 – showing some unsustainable weakness in price. It simply doesn’t look like a good trade is setting up anywhere here. However, if the S&P 500 futures chart breaches either 2257 or 2261, it is likely to test edges of higher resistance or lower support before retracing.
The lines in the sand for buyers to hold will be 2255-2257, as it was yesterday. Below that, we see 2251.50 and 2247.50. Charts will be weighted to the buyers as long if we recapture and hold 2261. Resistance remains 2267-2269, but could breach to test 2272.50. See today’s economic calendar with a rundown of releases.
TODAY’S RANGE OF MOTION
E-mini S&P 500 Futures Trading Chart For December 23
Upside trades – Two options for entry
Positive retest of continuation level -2260.5 (careful here – a retest is required)
Positive retest of support level– 2257.75
Opening targets ranges for non-members -2261.75, 2263.5, 2267.5, 2269.25, 2271.25, 2272.75, 2275.50, 2278.25 and 2282.50
Downside trades – Two options for entry
Failed retest of resistance level -2260 (needs retest confirmation)
Failed retest of support level– 2255.25 (also needs confirmation due to price forms)
Opening target ranges for non-members –2257, 2255.75, 2251.5, 2249.50, 2246.50, 2242.75, 2238.75, 2234.75, 2231.50, 2227.75, 2224.25, and 2224.25
Nasdaq Futures
The NQ_F range has tightened with our support level now near 4916 holds steady at this time. As with the ES_F, we lost support and quickly recaptured price at congestion. The wider box of trading has 4916 as support and 4944 as resistance. Secondary support is 4894 (remember the auction vacuum there). Resistance now holds near 4952 to 4957.
Upside trades – Two options
Positive retest of continuation level -4942.50 (needs confirmation)
Positive retest of support level– 4917.50 (also needs confirmation)
Opening target ranges for non-members –4924.75, 4930.25, 4937.25, 4941.75, 4944.25, 4947, 4952.25, 4957.75, 4965.50, 4972.25, 4979.75, and 4988.75
Downside trades- Two options
Failed retest of resistance level -4936 (careful here – negative divergence needs to be present)
Failed retest of support level– 4914
Opening target ranges for non-members –4931.50, 4925.75, 4920.75, 4914.25, 4907.50, 4902.75, 4898.75, 4883.75, 4876.25, 4872.25, 4863.75, 4859.75, 4854.75, and 4847.50
WTI Crude Oil
A tight trading range over the last 20 hours puts oil in the same kind of price form as much of the broad market. The region near 53.14-52.9 is resistance, shifted lower again from yesterday. Trending formations continue to form weak non trending patterns, making probabilities for success a bit lower. Support sits between 52.22 and 52.04, and below that we see 51.59 and then 50.87, if sellers hold control. Bullish formations are fading in the chart for now, but we hold in a range overall – between 50.65 and 53.65.
Upside trades – Two options
Positive retest of continuation level -52.82
Positive retest of support level– 52.12
Opening target ranges for non-members –52.3, 52.54, 52.97, 53.23, 53.41, 53.6, 53.86, 54.04, 54.21, 54.5, 54.97, and 55.4
Downside trades- Two options
Failed retest of resistance level -52.6
Failed retest of support level– 52.06 –
Opening target ranges for non-members –52.32, 52.09, 51.85, 51.57, 51.32, 51.08, 50.27, 50.13, 49.87, 49.6, 49.27, 49.05, and 48.92
If you’re interested in watching these trades go live, join us in the live trading room from 9am to 11:30am each trading day.
Visit TheTradingBook for more information.
If you’re interested in the live trading room, it is now primarily stock market futures content, though we do track heavily traded stocks and their likely daily trajectories as well – we begin at 9am with a morning report and likely chart movements along with trade setups for the day.
As long as the trader keeps himself aware of support and resistance levels, risk can be very adequately managed to play in either direction as bottom picking remains a behavior pattern that is developing with value buyers and speculative traders.
Twitter: @AnneMarieTrades
The author trades stock market futures every day and may have a position in mentioned securities at the time of publication. Any opinions expressed herein are solely those of the author, and do not in any way represent the views or opinions of any other person or entity.

: Creating Bullish Divergence?")


: Creating Bullish Divergence?")

