Stock Market Futures Outlook for December 16, 2016 –
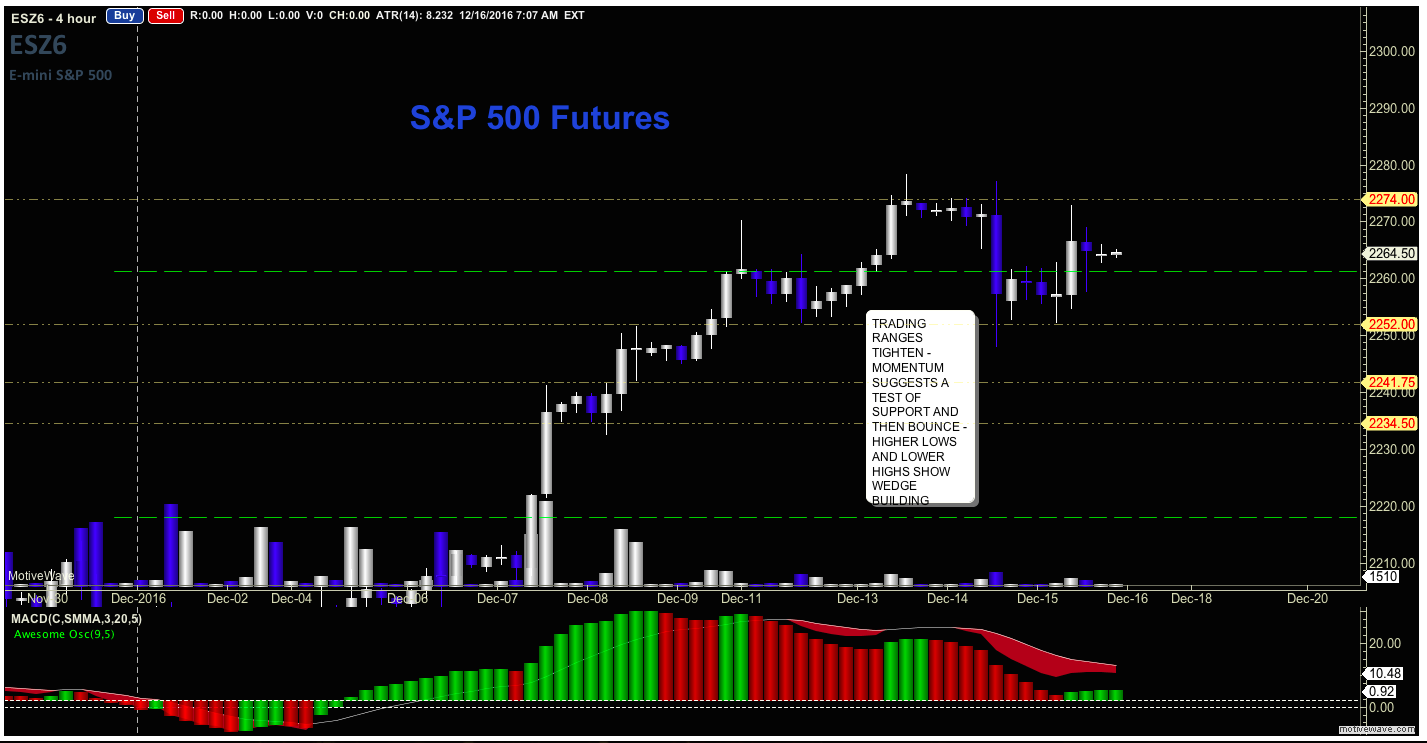
More choppy action seems to be in line today for the S&P 500 (INDEXSP:.INX), as charts hold above the lows (near 2246 on futures) but fail to breach the highs (near 2270 on the futures). There is a saying that goes, ‘Never short a dull market’, and I suspect this might just be that kind of market right now. With the possibility of a ‘Santa Claus’ rally on the horizon and traders reminding us of a possible ‘January effect’, upside is not out of the question in the short run.
So, how do we know what to do? Watch for the confirmation of those price breaks before getting involved as probabilities hold close to coin tosses today. The line in the sand for buyers to hold will be 2246, and below that, 2240. Resistance remains 2269, but could breach to test 2272.50, then 2282.75, if the charts continue with higher lows.
See today’s economic calendar with a rundown of releases.
TODAY’S RANGE OF MOTION
S&P 500 Futures Trading Outlook – December 16
Upside trades – Two options for entry
Positive retest of continuation level – 2263.75
Positive retest of support level – 2252.5
Opening targets ranges – 2254.50, 2257.25, 2260.50, 2263.75, 2267.75, 2270.25, 2273, 2275.50, 2278.25 and 2282.50
Downside trades – Two options for entry
Failed retest of resistance level – 2260.75 (needs confirmation in these formations
Failed retest of support level – 2251.25
Opening target ranges – 2254.75, 2251.5, 2249.50, 2246.50, 2242.75, 2238.75, 2234.75, 2231.50, 2227.75, 2224.25, and 2224.25
Nasdaq Futures
The NQ_F is also forming a wedge, and remains landlocked for the third day. Failure to hold 4920 and we’ll see 4898.50, and lower. Momentum is positive, but drifting. Patterns are messy, suggesting the best trades will be long off support edges clearly visible into resistance. The reversal will also hold, but the power of motion still sits with the buyers this morning. Resistance now holds near 4940 to 4961. There is an auction vacuum that sits in the range between 4878 and 4890.
Upside trades – Two options
Positive retest of continuation level -4950.50 (needs confirmation)
Positive retest of support level– 4920.50
Opening target ranges for non-members –4924.25, 4930.25, 4934.50, 4939.75, 4942.25, 4947, 4959.75, 4965.50, and 4988.75
Downside trades- Two options
Failed retest of resistance level -4938.50 (careful here – negative divergence needs to be present)
Failed retest of support level– 4917.75
Opening target ranges – 4934.25, 4930.50, 4925.75, 4920.75, 4911.75, 4907.50, 4902.75, 4898.75, 4883.75, 4876.25, 4872.25, 4863.75, 4859.75, 4854.75, and 4847.50
Crude Oil – WTI
Charts were in contango, and the contract roll presents the gap up for us to see today. As news stays muted this morning, I suspect we fill the gap and then chop a bit sideways. Bounce action looks present near 50.65, a familiar level to those of us trading oil. Resistance is near 52.44 for now and should buyers press forward, the positive retest of this region represents long opportunities into higher levels near 53.
Upside trades – Two options
Positive retest of continuation level – 51.04
Positive retest of support level – 50.65
Opening target ranges – 50.86, 51.05, 51.24, 51.55, 51.92, 52.34, 52.64, 52.86, 53.23, 53.41, 53.8, 54.04, 54.21, 54.5, 54.97, and 55.4
Downside trades- Two options
Failed retest of resistance level – 51.5
Failed retest of support level – 52.05
Opening target ranges – 51.92, 51.85, 51.57, 51.32, 51.08, 50.27, 50.13, 49.87, 49.6, 49.27, 49.05, and 48.92
If you’re interested in watching these trades go live, join us in the live trading room from 9am to 11:30am each trading day.
Visit TheTradingBook for more information.
If you’re interested in the live trading room, it is now primarily stock market futures content, though we do track heavily traded stocks and their likely daily trajectories as well – we begin at 9am with a morning report and likely chart movements along with trade setups for the day.
As long as the trader keeps himself aware of support and resistance levels, risk can be very adequately managed to play in either direction as bottom picking remains a behavior pattern that is developing with value buyers and speculative traders.
Twitter: @AnneMarieTrades
The author trades stock market futures every day and may have a position in mentioned securities at the time of publication. Any opinions expressed herein are solely those of the author, and do not in any way represent the views or opinions of any other person or entity.


