Stock Market Trading Considerations December 11, 2017
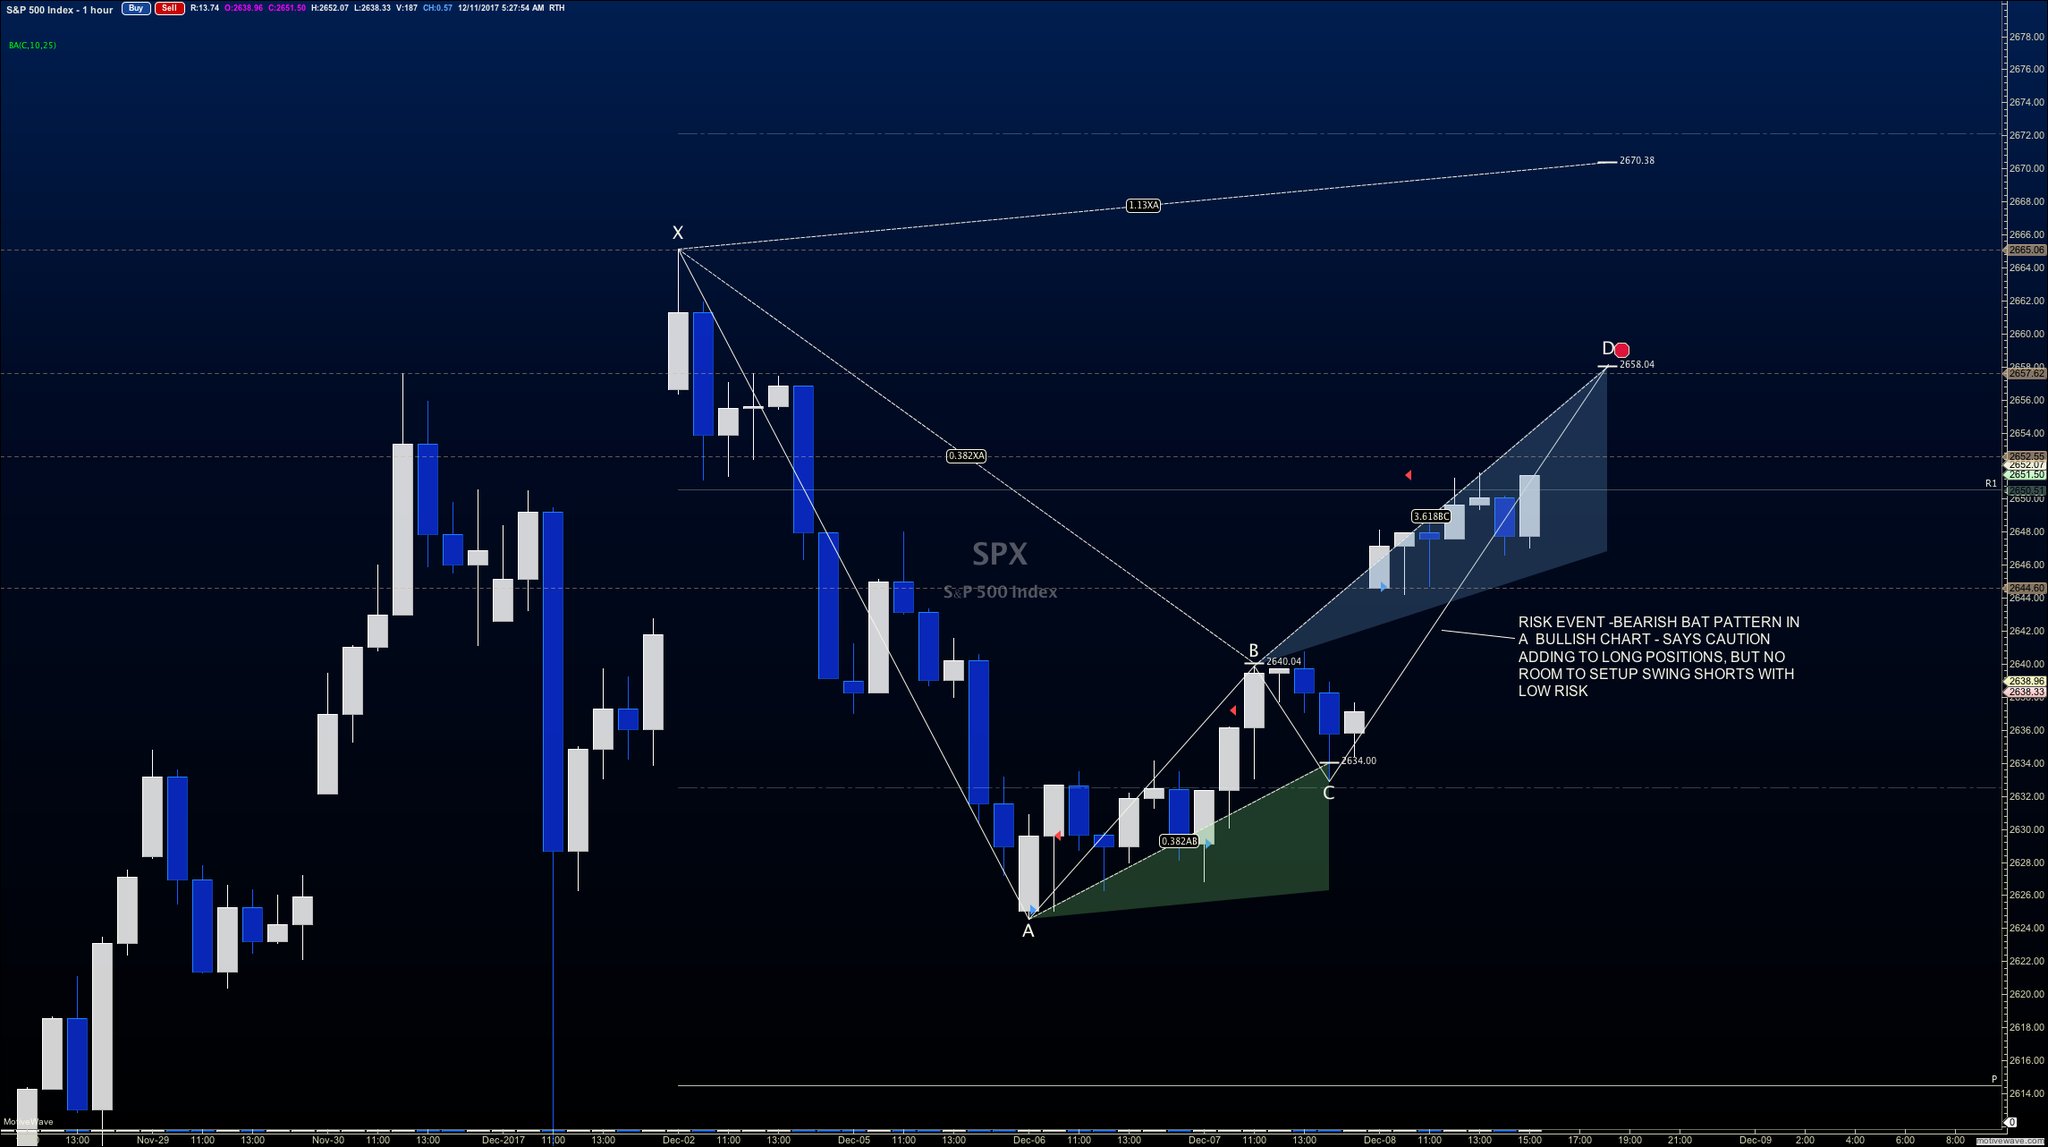
The S&P 500 is testing upside resistance in an effort to breakout to new all-time highs. But a tricky short-term bearish pattern may slow its advance. In the commentary below I break down the trading setups for S&P 500 and Nasdaq futures indices along with crude oil.
You can access today’s economic calendar with a full rundown of releases.
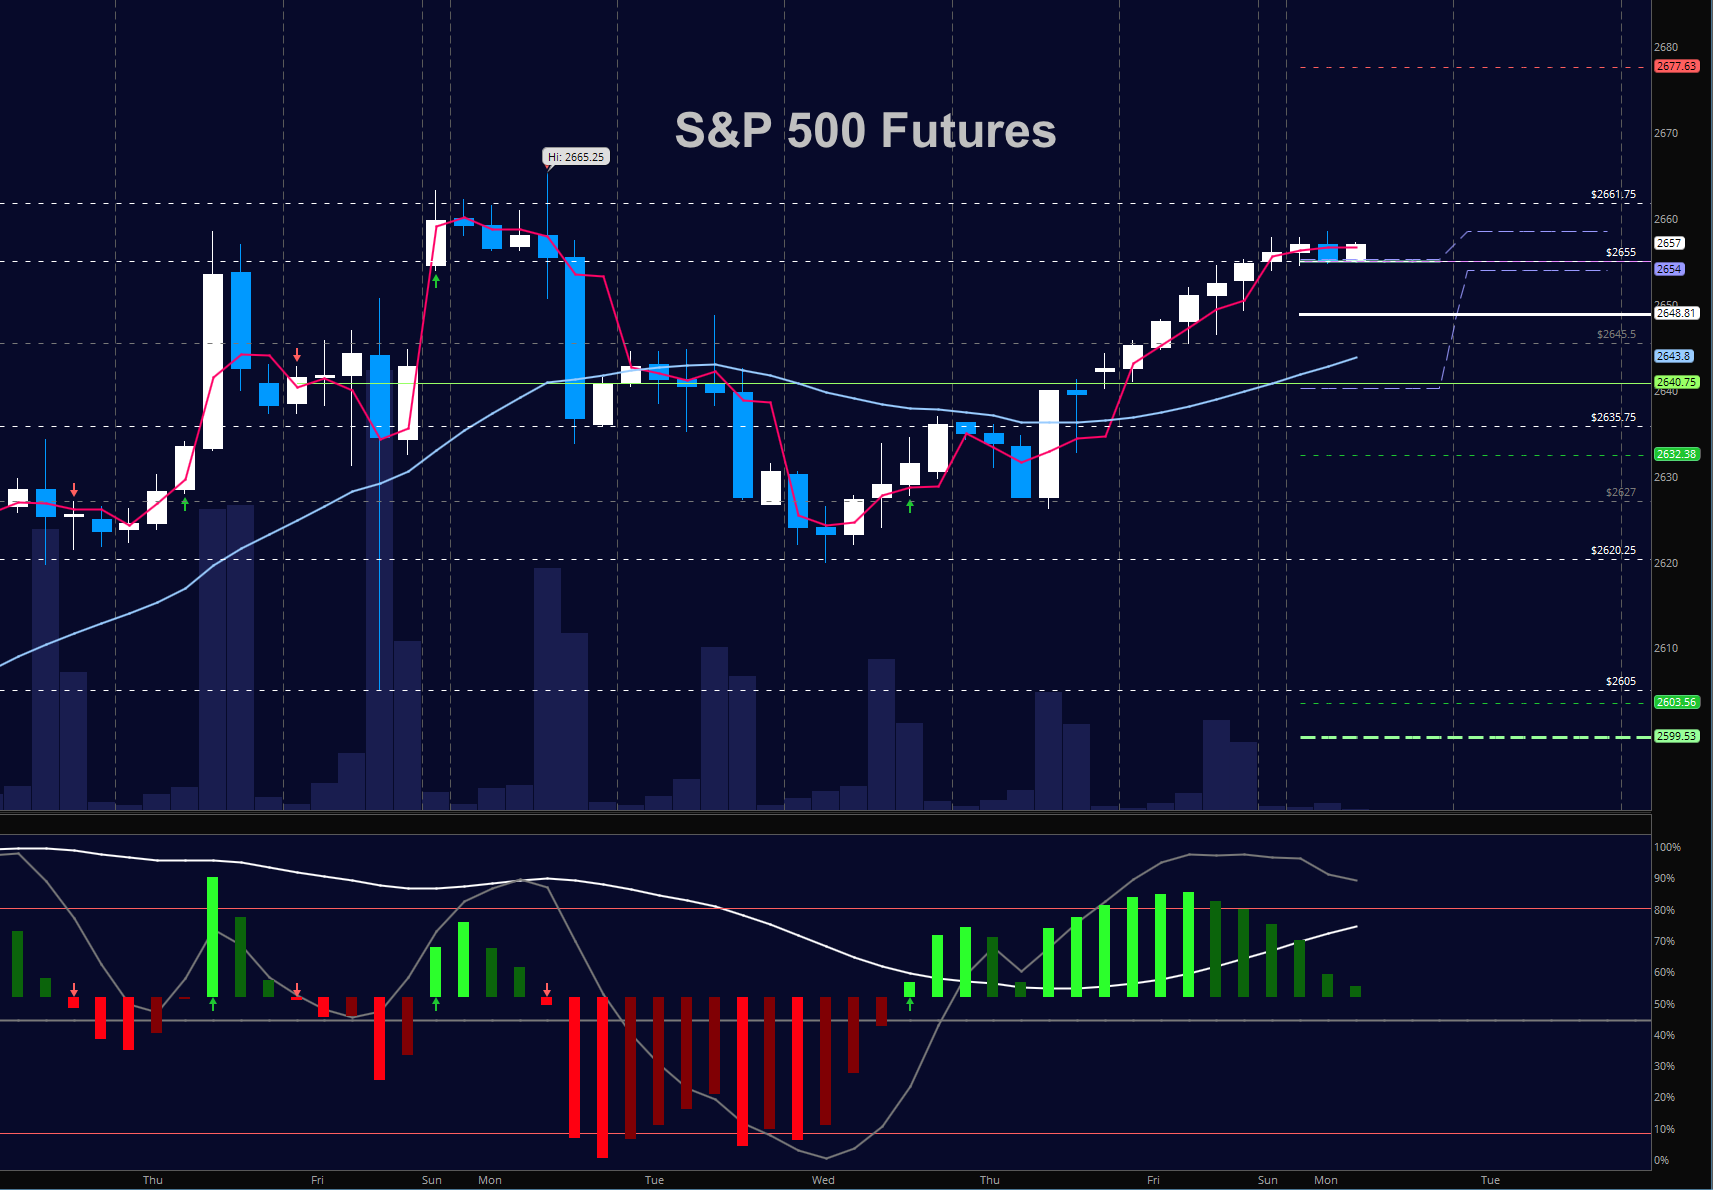
S&P 500 Futures
Buyers continued their march up on Friday and have held higher lows into the morning hours as Bitcoin futures begin trading (higher- in case you wondered ;). Lower highs are still presenting with sellers above near 2658.5. Buyers will likely be ready at the dips lower but we appear to be in some measure of consolidation and price acceptance. Stronger support sits near 2640. The bullets below represent the likely shift of trading momentum at the positive or failed retests at the levels noted.
- Buying pressure intraday will likely strengthen with a positive retest of 2657.75
- Selling pressure intraday will likely strengthen with a failed retest of 2648.5
- Resistance sits near 2658.5 to 2661.5, with 2665.5 and 2672.5 above that.
- Support holds between 2654.5 and 2651.25, with 2645.5 and 2637.5 below that.
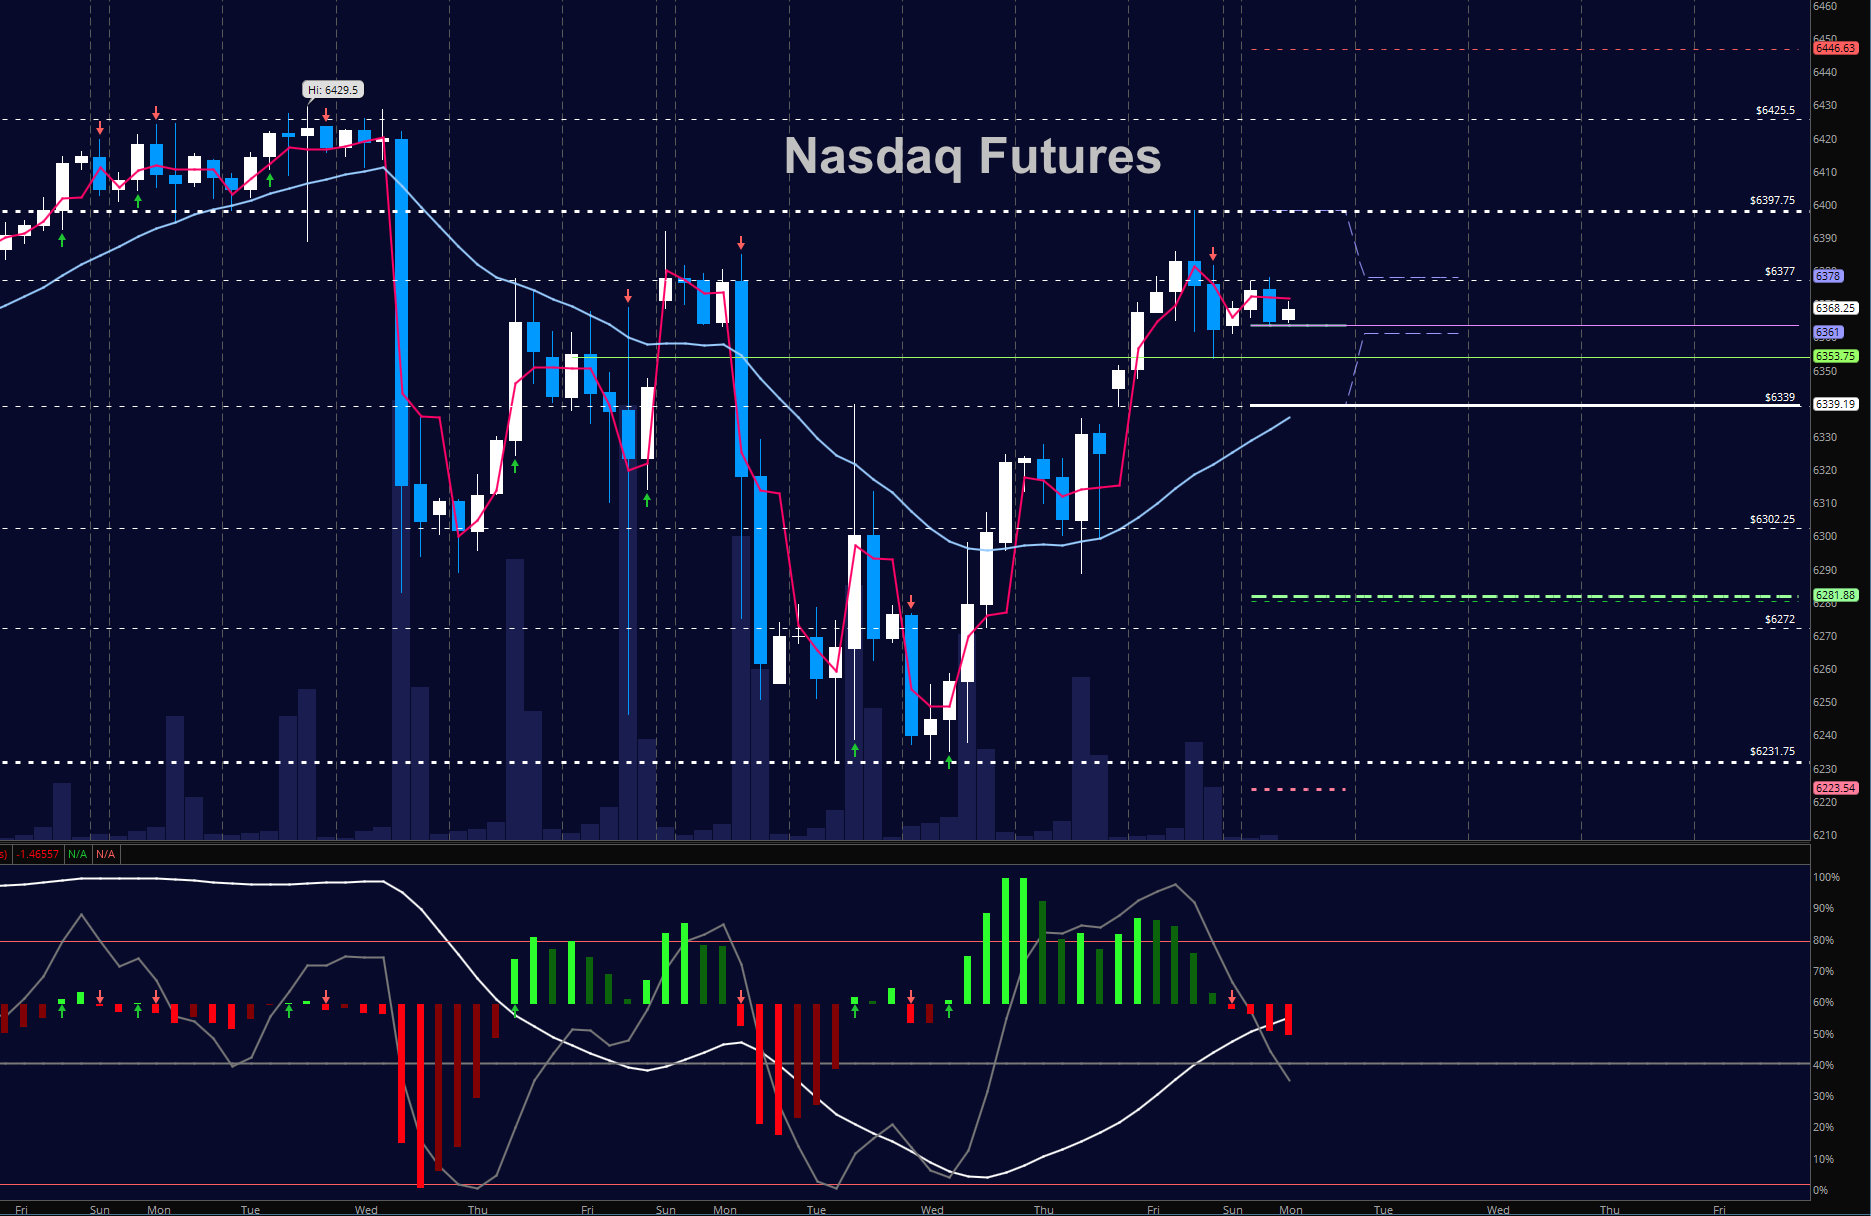
NASDAQ Futures
Traders are still working on recovery but momentum is drifting lower still. Support retests are likely with these kinds of patterns and I will be watching the regions near 6330 to hold if buyers have the strength to continue forward. A breach of 6397 and buyers will be pressing to prior highs. Formations are messy and in a wide range. The bullets below represent the likely shift of intraday trading momentum at the positive or failed tests at the levels noted.
- Buying pressure intraday will likely strengthen with a positive retest of 6383.5
- Selling pressure intraday will likely strengthen with a failed retest of 6335.5
- Resistance sits near 6377.5 to 6397 with 6414.75 and 6422.75 above that.
- Support holds near 6362.5 and 6350.75, with 6339.25 and 6302.75 below that.
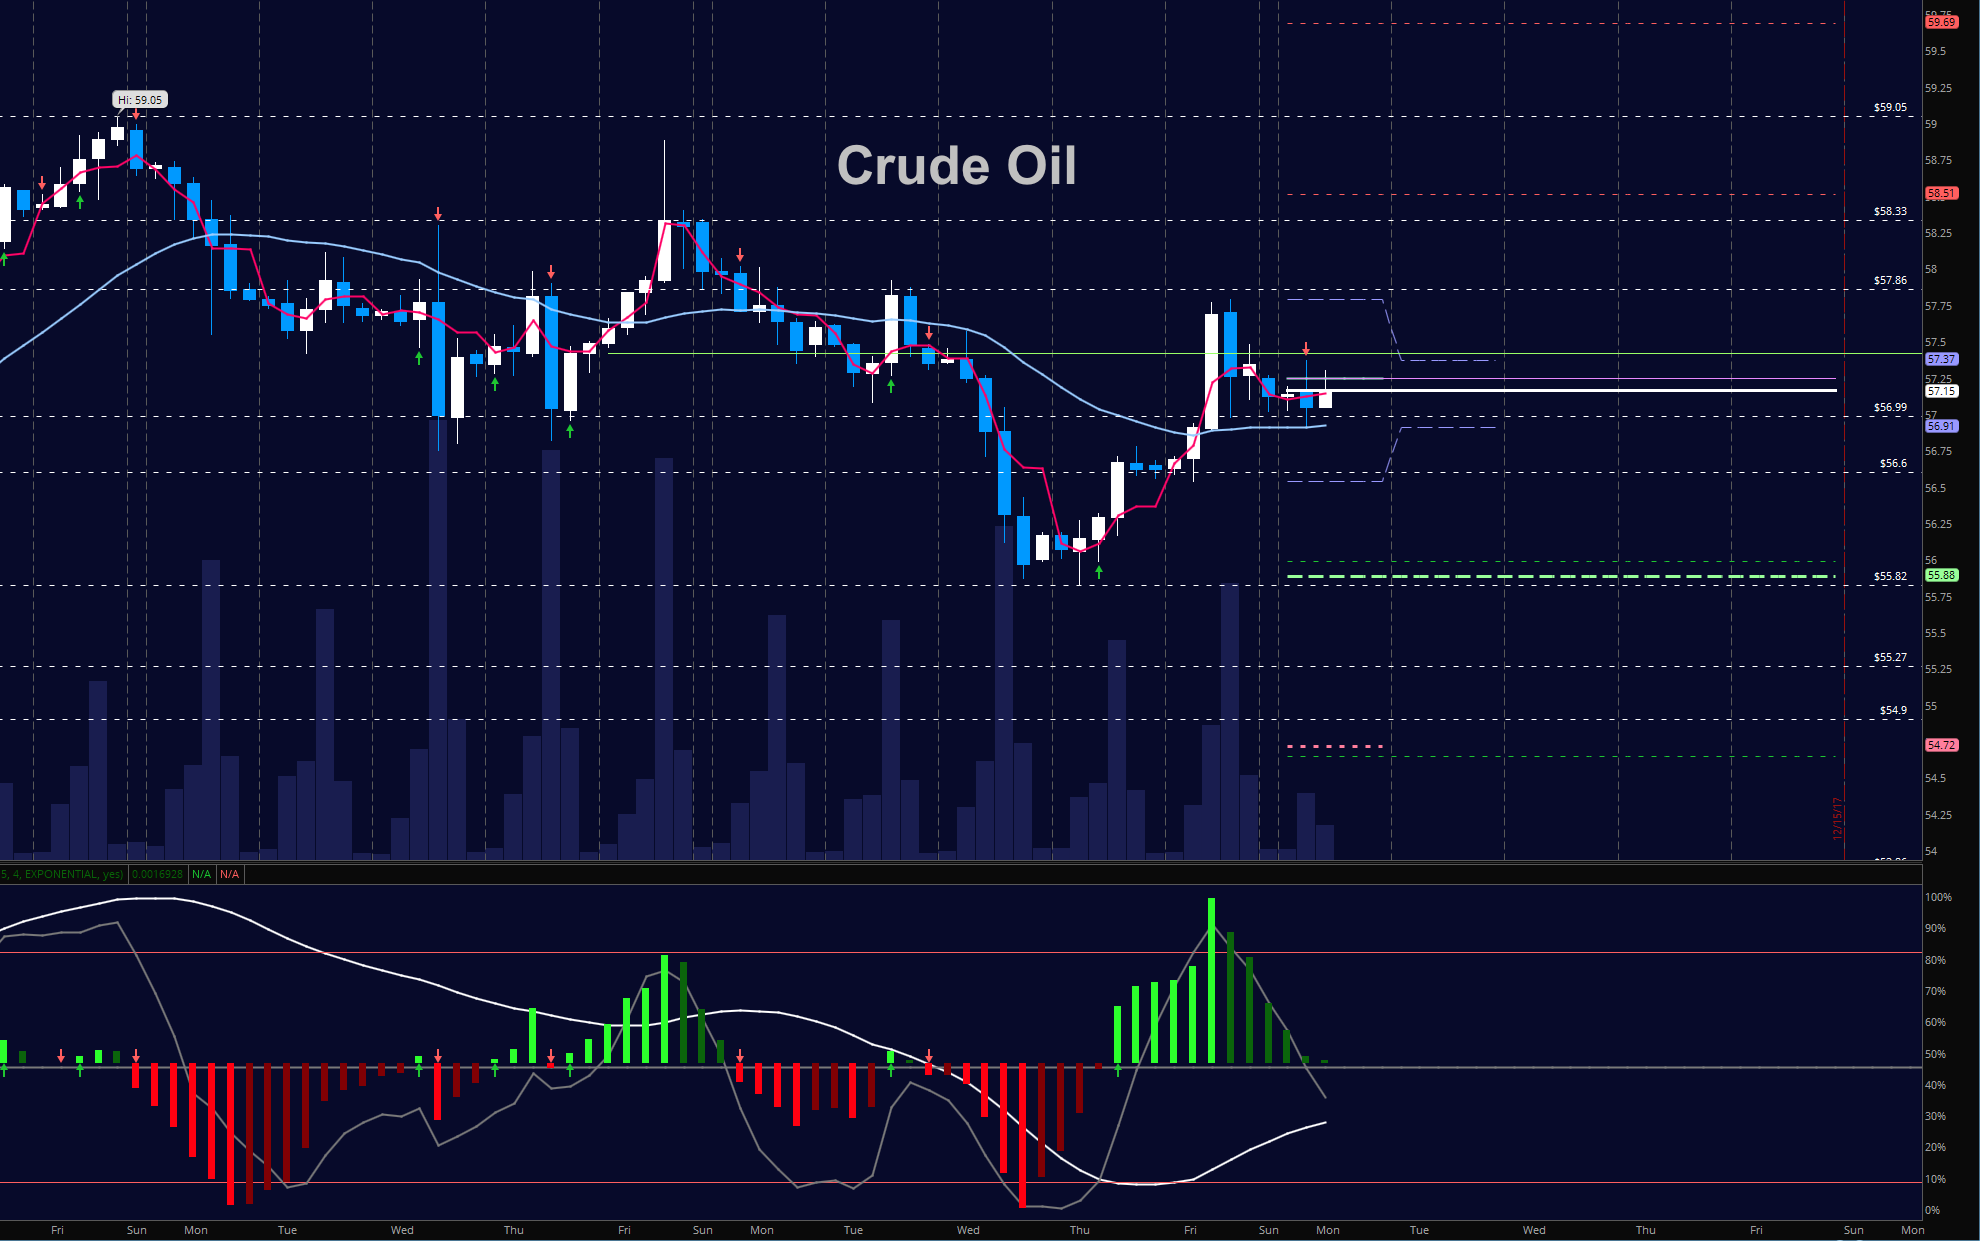
WTI Crude Oil
Congestion formations hold us below 57.5. Below 56.6 and we could see a fade into 55.78 and then 54.96 – but at this writing, this seems a bit unlikely. Holding 56.8 will be key. The bullets below represent the likely shift of trading momentum at the positive or failed tests at the levels noted.
- Buying pressure intraday will likely strengthen with a positive retest of 57.47
- Selling pressure intraday will strengthen with a failed retest of 56.6
- Resistance sits near 57.37 to 57.86, with 58.3 and 59.05 above that.
- Support holds near 56.9 to 56.64, with 56.04 and 55.78 below that.
Twitter: @AnneMarieTrades
The author trades stock market futures every day and may have a position in mentioned securities at the time of publication. Any opinions expressed herein are solely those of the author, and do not in any way represent the views or opinions of any other person or entity.


