S&P 500 Futures Outlook for August 8, 2016 (Broad Overview) – Favorable employment numbers the S&P 500 Index (INDEXSP:.INX) higher on Friday and the breakout is still holding.
Upside price targets for an expansion appear to be near 2204 on S&P 500 futures for the week. We’ll be watching that development carefully. Stock market momentum has shifted into bullish patterns but we should see a timid continuation with a few fades and retests of congestion near 2177. New price support for S&P 500 futures sits near 2174-2176, and below that we see 2171-2172.5. More price congestion lies in the 2166.5 region. Price resistance is now at 2183 and 2187.5 today, and if breached, should retest.
See today’s economic calendar with a rundown of releases.
RANGE OF TODAY’S MOTION
S&P 500 Futures Trading Outlook – Chart (ES_F)
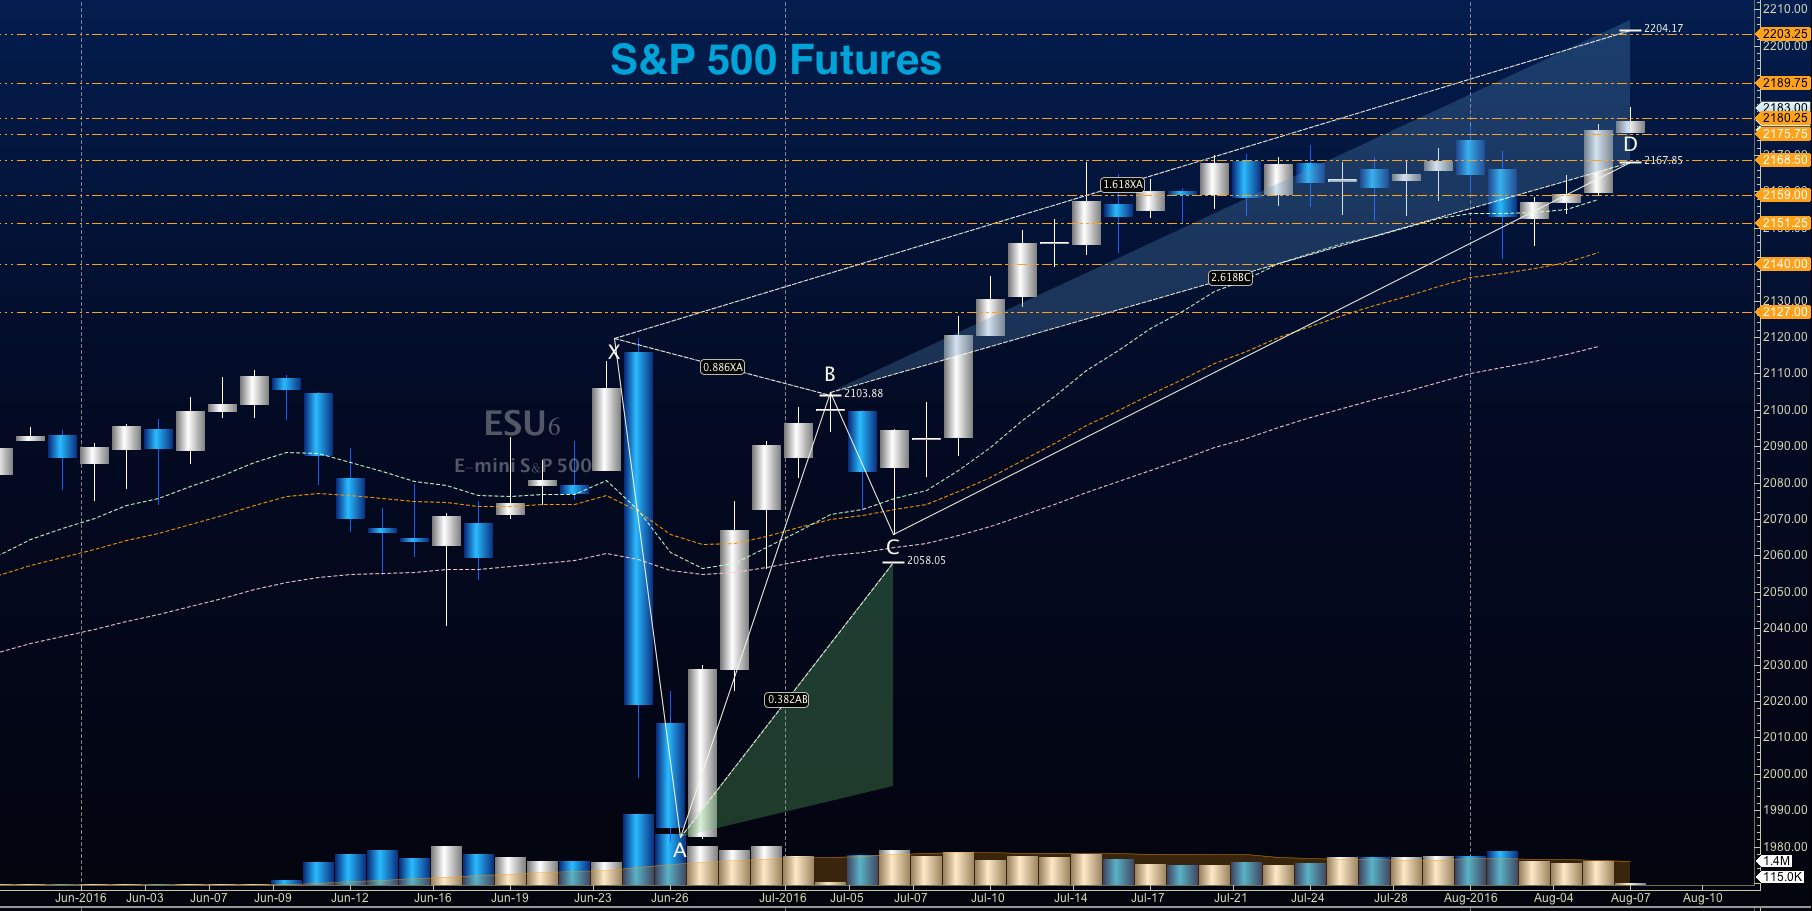
Upside trades on S&P 500 futures – Favorable setups sit on the positive retest of 2183, or a positive retest of the bounce off 2176 with positive momentum. I use the 30min to 1hr chart for the breach and retest mechanic. Targets from 2176 are 2178.25, 2181.5, 2183, 2184.5, 2187.5 and if we expand, we may stretch above into 2189.75 and 2190.5.
Downside trades on S&P 500 futures – Favorable setups sit below the failed retest of 2175.75 or at the first failed retest of 2182.5 with negative divergence. Keep your eyes on the lookout for higher lows developing intraday. Retracement into lower levels from 2182.5 gives us the targets 2180.5, 2177.75, 2175.75, 2172.5, 2169.5, 2166.75, 2164.5, 2161.5, 2159.5, 2156.75, 2153.5, 2151.5, 2149.5, 2145.75, and 2141.5, if sellers take over.
If you’re interested in watching these trades go live, join us in the live trading room from 9am to 11:30am each trading day.
Nasdaq Futures (NQ_F)
The NQ_F continues to build momentum but has rejected the new morning highs and is now drifting into support near 4787 to 4784. Below that, we see 4781-4774 as downside stretches, if sellers take control. Resistance levels are now between 4800-4808.75, with a breach that could stretch into 4822 in the coming days. Buying breakouts have not been the best bet for traders, but the retests of support action have worked nicely, and should continue to do so.
Upside trades on Nasdaq futures – Favorable setups sit on the positive retest of 4798.5, or a positive retest of 4781.5 with positive momentum. I use the 30min to 1hr chart for the breach and retest mechanic. Targets from 4781.5 are 4787.25, 4791, 4793.75, 4795.5, 4798.5, 4800.75, 4804, 4808.5, 4812, and 4816.25 to 4822.25, if buyers continue the rally north.
Downside trades on Nasdaq futures – Favorable setups sit below the failed retest of 4781, or at the failed retest of 4794.5 with negative divergence. Retracement into lower levels from 4794.5 gives us the targets 4791.5, 4787.5, 4784.25, 4781.5, 4776.75, 4772.25, 4766.5, 4762.25, 4754.5, 4746.75, 4743.5, 4739.75, 4735.75, 4730.5, and 4726.5 to 4721.5, if sellers resume control.
Crude Oil
Oil prices have breached resistance of 42.26 and tried to fade but buying pressure holds steady as hedge funds show a continued short presence in the chart. I suspect we move north into 43.11 to 43.4, before a drift of upside comes into play. Support looks to be in the vicinity of 41.69, but aggressive selling could bring the chart into 41.4. Pullbacks are likely to be bought in the current cycle, even as significant resistance is present ahead.
Trading ranges for crude oil should hover between 42.07 and 43.48, with the number near 41.4 being a very important number for the chart to hold if we are buyers.
Upside trades on crude oil can be staged on the positive retest of 42.28, or at a bounce off 41.86 with positive momentum. I often use the 30min to 1hr chart for the breach and retest mechanic. Targets from 41.86 are 42.07, 42.24, 42.45, 42.78, 42.9, 43.1, 43.45, and perhaps, 43.61, if buyers really take control.
Downside trades can be staged on the failed retest of 42.2, or at the failed retest of 43.03 with negative divergence. Targets from 43.03 are 42.74, 42.4, 42.24, 42.11, 41.98, 41.75, 41.63, 41.54, 41.4, 41.16, 40.94, 40.77, 40.57, 40.34, 40.19, 39.87, 39.56, 39.38, 39.26, 39.02, 38.74, 38.42 and 38.22.
If you’re interested in watching these trades go live, join us in the live trading room from 9am to 11:30am each trading day. It is now primarily stock market futures trading content, though we do track heavily traded stocks and their likely daily trajectories as well – we begin at 9am with a morning report and likely chart movements along with trade setups for the day. Visit TheTradingBook.com for more information.
As long as the trader keeps himself aware of support and resistance levels, risk can be very adequately managed to play in either direction as bottom picking remains a behavior pattern that is developing with value buyers and speculative traders.
Twitter: @AnneMarieTrades
The author trades stock market futures every day and may have a position in mentioned securities at the time of publication. Any opinions expressed herein are solely those of the author, and do not in any way represent the views or opinions of any other person or entity.


