S&P 500 Futures Trading: Broad Market Outlook for August 2, 2016
The fade to familiar support brought S&P 500 futures back into the 2159 area in the early morning. This is where we have traditionally seen buyers come to the rescue. Today though, stock market futures charts look a bit bearish. I expect bounces should fail into deeper support near 2151. If we break below that, we should see 2145-2148. The S&P 500 Index (INDEXSP:.INX) and S&P 500 futures both sit at the lower edge of congestion. The chart of S&P 500 futures certainly shows a need for bulls to recapture the upper edges. Otherwise a breakout may be on hold. Deeper price support sits near 2125, while price resistance holds steady between 2172 and 2177 today.
See today’s economic calendar with a rundown of releases.
RANGE OF TODAY’S MOTION
S&P 500 Futures Trading Chart (ES_F)
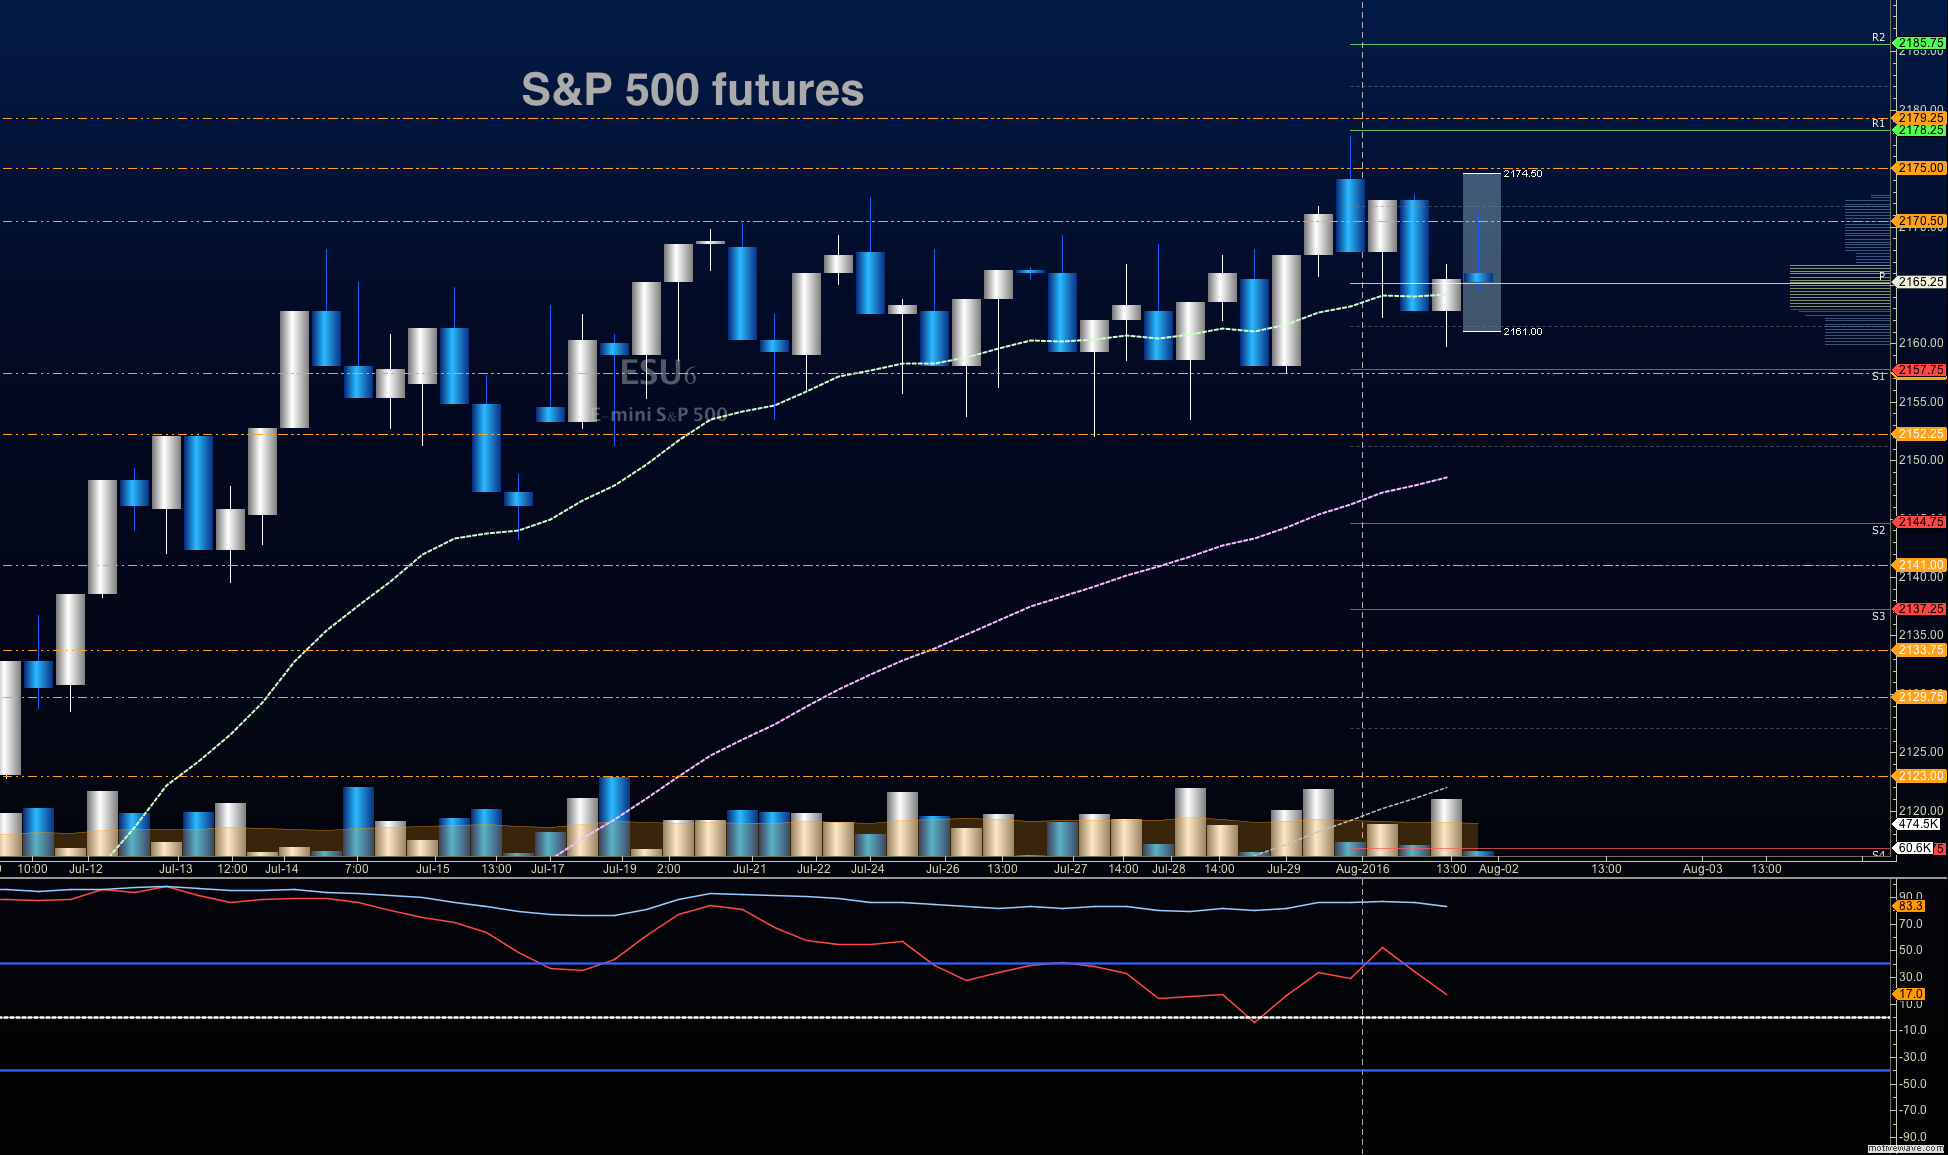
Upside trades on S&P 500 futures – Favorable setups sit on the positive retest of 2171.5, or a positive retest of the bounce off 2161.5 with positive momentum. Remember that the feel of the chart is congestion, so breakouts will be difficult to maintain. I use the 30min to 1hr chart for the breach and retest mechanic. Targets from 2161.5 are 2166.25, 2169.25, 2171, 2174.75, 2177.25, 2179.25, 2180.25, and if we expand, we may stretch above into 2184.5 and 2189.75.
Downside trades on S&P 500 futures – Favorable setups sit below the failed retest of 2159 or at the first failed retest of 2170.5 with negative divergence. Keep your eyes on the lookout for higher lows developing intraday. Retracement into lower levels from 2170.5 gives us the targets 2166.5, 2163, 2060.5, 2158.25, 2155.75, 2153.5, 2149.75, 2145.75, and 2143.75 to 2141.5, if sellers take over.
Nasdaq Futures (NQ_F)
Nasdaq futures rose to an all time high yesterday at 4760.25, but after a failed attempt to breach and a double top formation on the hourly chart, retraced into breakout levels near 4732.25. New support rests near 4719, with a lower break into 4692, if sellers gain traction. Resistance levels are now between 4760-4785. Expansions beyond there look like 4890.5. Breaches should retest before any real expansion holds (as the chart continues to show us day after day). Value buyers at support levels have done well over the last few weeks, but dips may be a bit deeper as momentum drifts south.
Upside trades on Nasdaq futures – Favorable setups sit on the positive retest of 4746.5, or a positive retest of 4732.75 with positive momentum. I use the 30min to 1hr chart for the breach and retest mechanic. Watch for the lower high to develop with this range break, if sellers exercise more power intraday. Targets from 4732.75 are 4737.5, 4741, 4744.5, 4747.75, 4749.75, 4751.75, 4756.25, 4759.25, and 4767.75, if buyers continue the rally north.
Downside trades on Nasdaq futures – Favorable setups sit below the failed retest of 4732, or at the failed retest of 4749.5 with negative divergence. Retracement into lower levels from 4749.5 gives us the targets 4744.5, 4739.5, 4732, 4727.75, 4725.75, 4721.5, 4717.5, 4712.75, 4708.5, 4705.75, 4703, 4698.75, 4693.75, 4691.25, 4687.75, 4682.75, 4678.5, 4664.75, and 4660.5 to 4658.5, if sellers resume control.
Crude Oil
API report after the close. Oil dropped sharply yesterday into Friday’s target of 39.85 and has bounced before testing Monday’s target of 39.55. Chatter is bearish, so they’ll likely attempt to sell off at resistance levels, as traders bet the bounce will hold. They have been accustomed to buying into the API number in three out of the last four Tuesdays, but resistance should provide trouble for this chart at the region between40.6 and 40.90
Trading ranges for crude oil should hover between 39.45 and 42.26.
Upside trades on crude oil can be staged on the positive retest of 40.24, or at a bounce off 39.85 with positive momentum. I often use the 30min to 1hr chart for the breach and retest mechanic. Targets from 39.85 are 40.19, 40.34, 40.57, 40.7, 40.84, 41.04, 41.25, 41.46, 41.67, 41.86, 42.16, 42.24, 42.45, 42.78, 42.97, 43.18, 43.3, 43.47, 43.68, 43.83, 44.02, 44.22, 44.49, and perhaps, 44.71, if buyers really take control – but these higher levels are very unlikely at this time.
Downside trades on crude oil can be staged on the failed retest of 40.56, or at the failed retest of 41.17 with negative divergence. Targets from 41.17 are 40.94, 40.76, 40.57, 40.34, 40.19, 39.87, 39.56, and perhaps 39.45.
If you’re interested in the live trading room, it is now primarily stock market futures content, though we do track heavily traded stocks and their likely daily trajectories as well – we begin at 9am with a morning report and likely chart movements along with trade setups for the day.
As long as the trader keeps himself aware of support and resistance levels, risk can be very adequately managed to play in either direction as bottom picking remains a behavior pattern that is developing with value buyers and speculative traders.
Twitter: @AnneMarieTrades
The author trades stock market futures every day and may have a position in mentioned securities at the time of publication. Any opinions expressed herein are solely those of the author, and do not in any way represent the views or opinions of any other person or entity.


