Stock Market Considerations For August 18, 2017
The S&P 500 (INDEXSP:.INX) is hovering around break even at market open, however weakness into Thursday’s close should carry us into lower supports yet. Below are key futures trading levels and considerations for the S&P 500, Nasdaq, and crude oil.
Check out today’s economic calendar with a full rundown of releases. And note that the charts below are from our premium service and shared exclusively with See It Market readers.
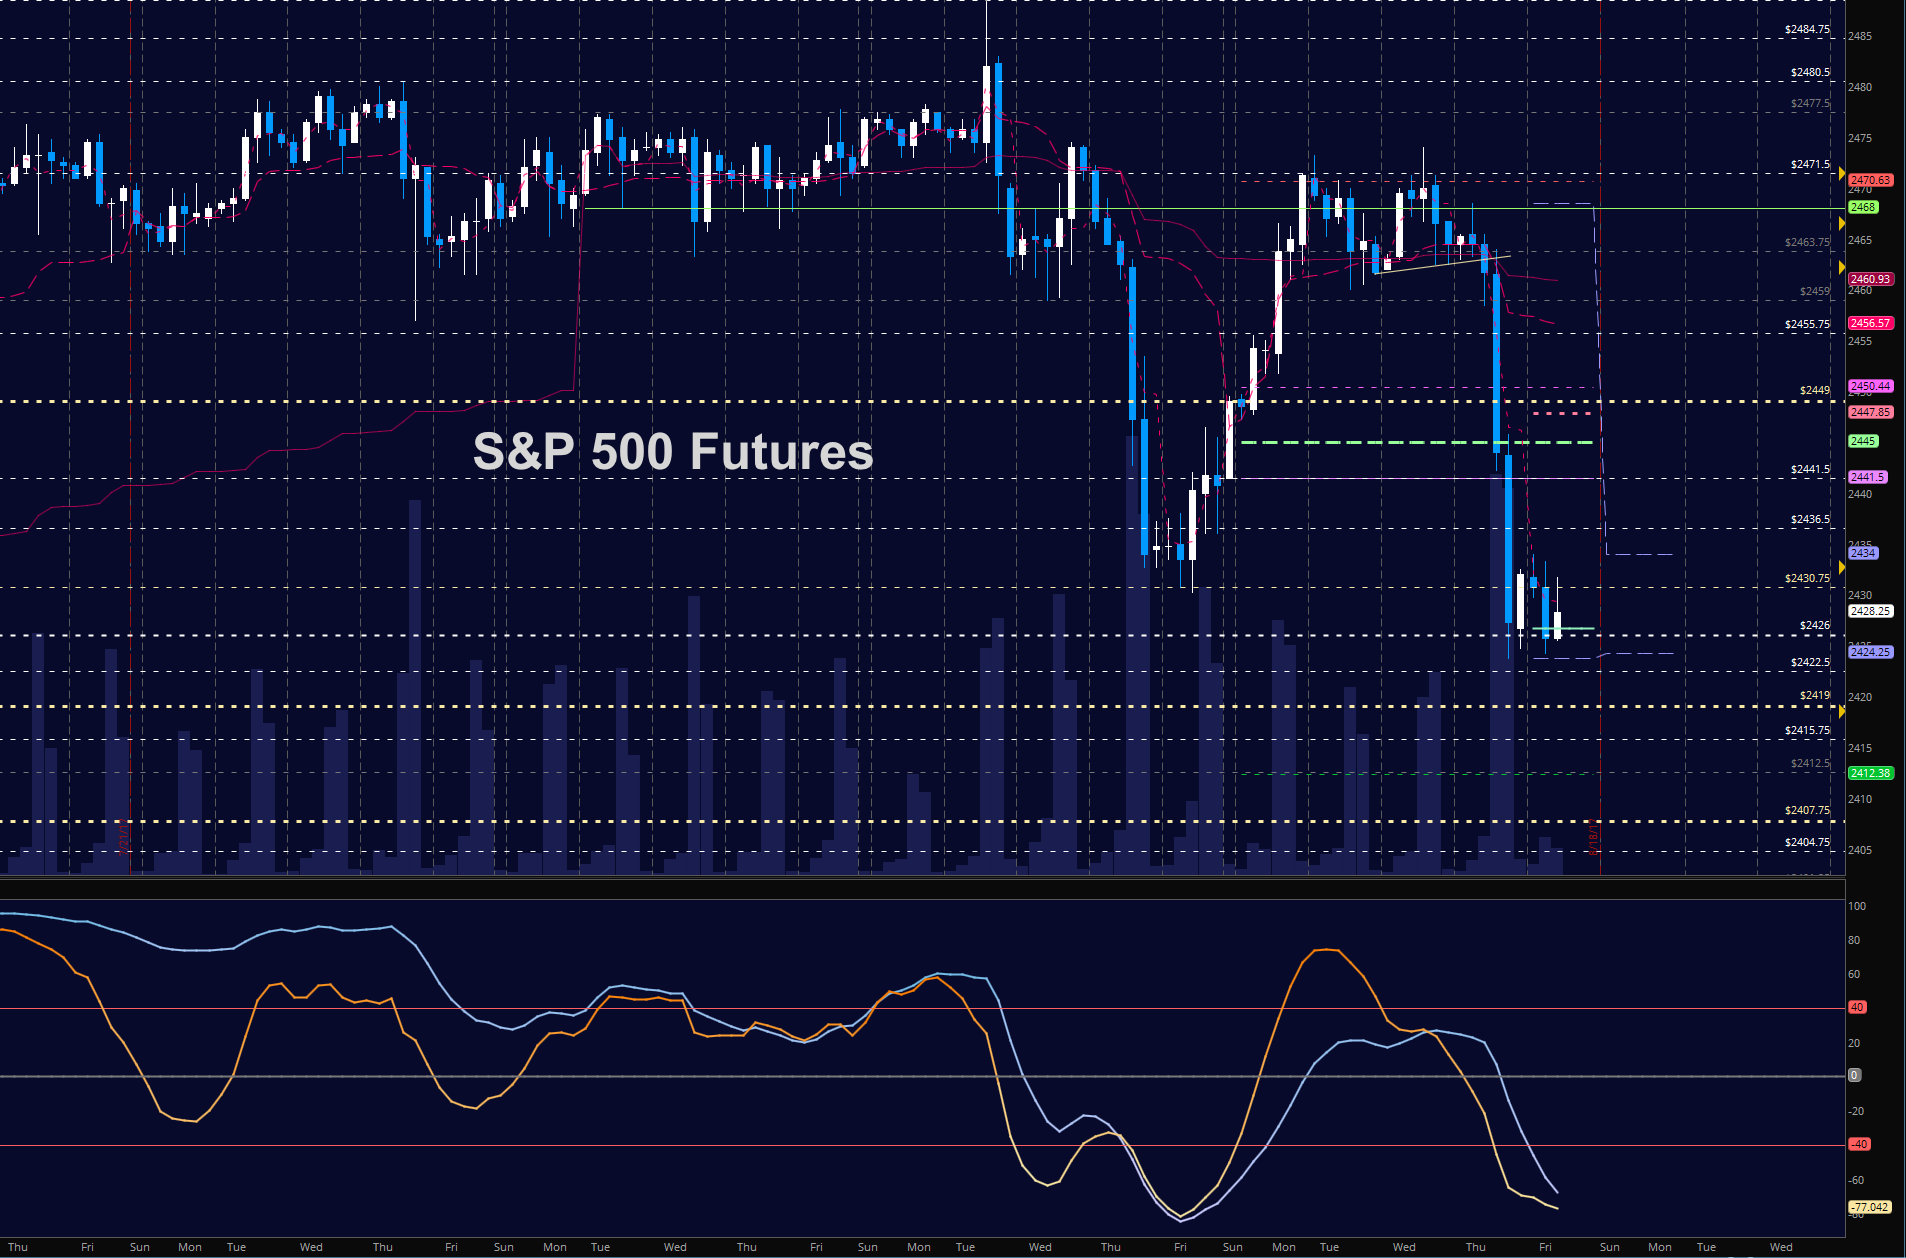
S&P 500 Futures (ES)
Charts hold lower support in the early morning. Sellers sit above near 2431. Bounces will find resistance and a failure to hold support will send us to even lower support again. The bullets below represent the likely shift of trading momentum at the positive or failed retests at the levels noted.
- Buying pressure intradaywill likely strengthen above a positive retest of 2431.5
- Sellingpressure intraday will likely strengthen with a failed retest of 2424
- Resistance sits near 2441.5 to 2445, with 2455.25 and 2460.5 above that.
- Support holds between 2424.25 and 2419.75, with 2415.5 and 2407.75 below that.
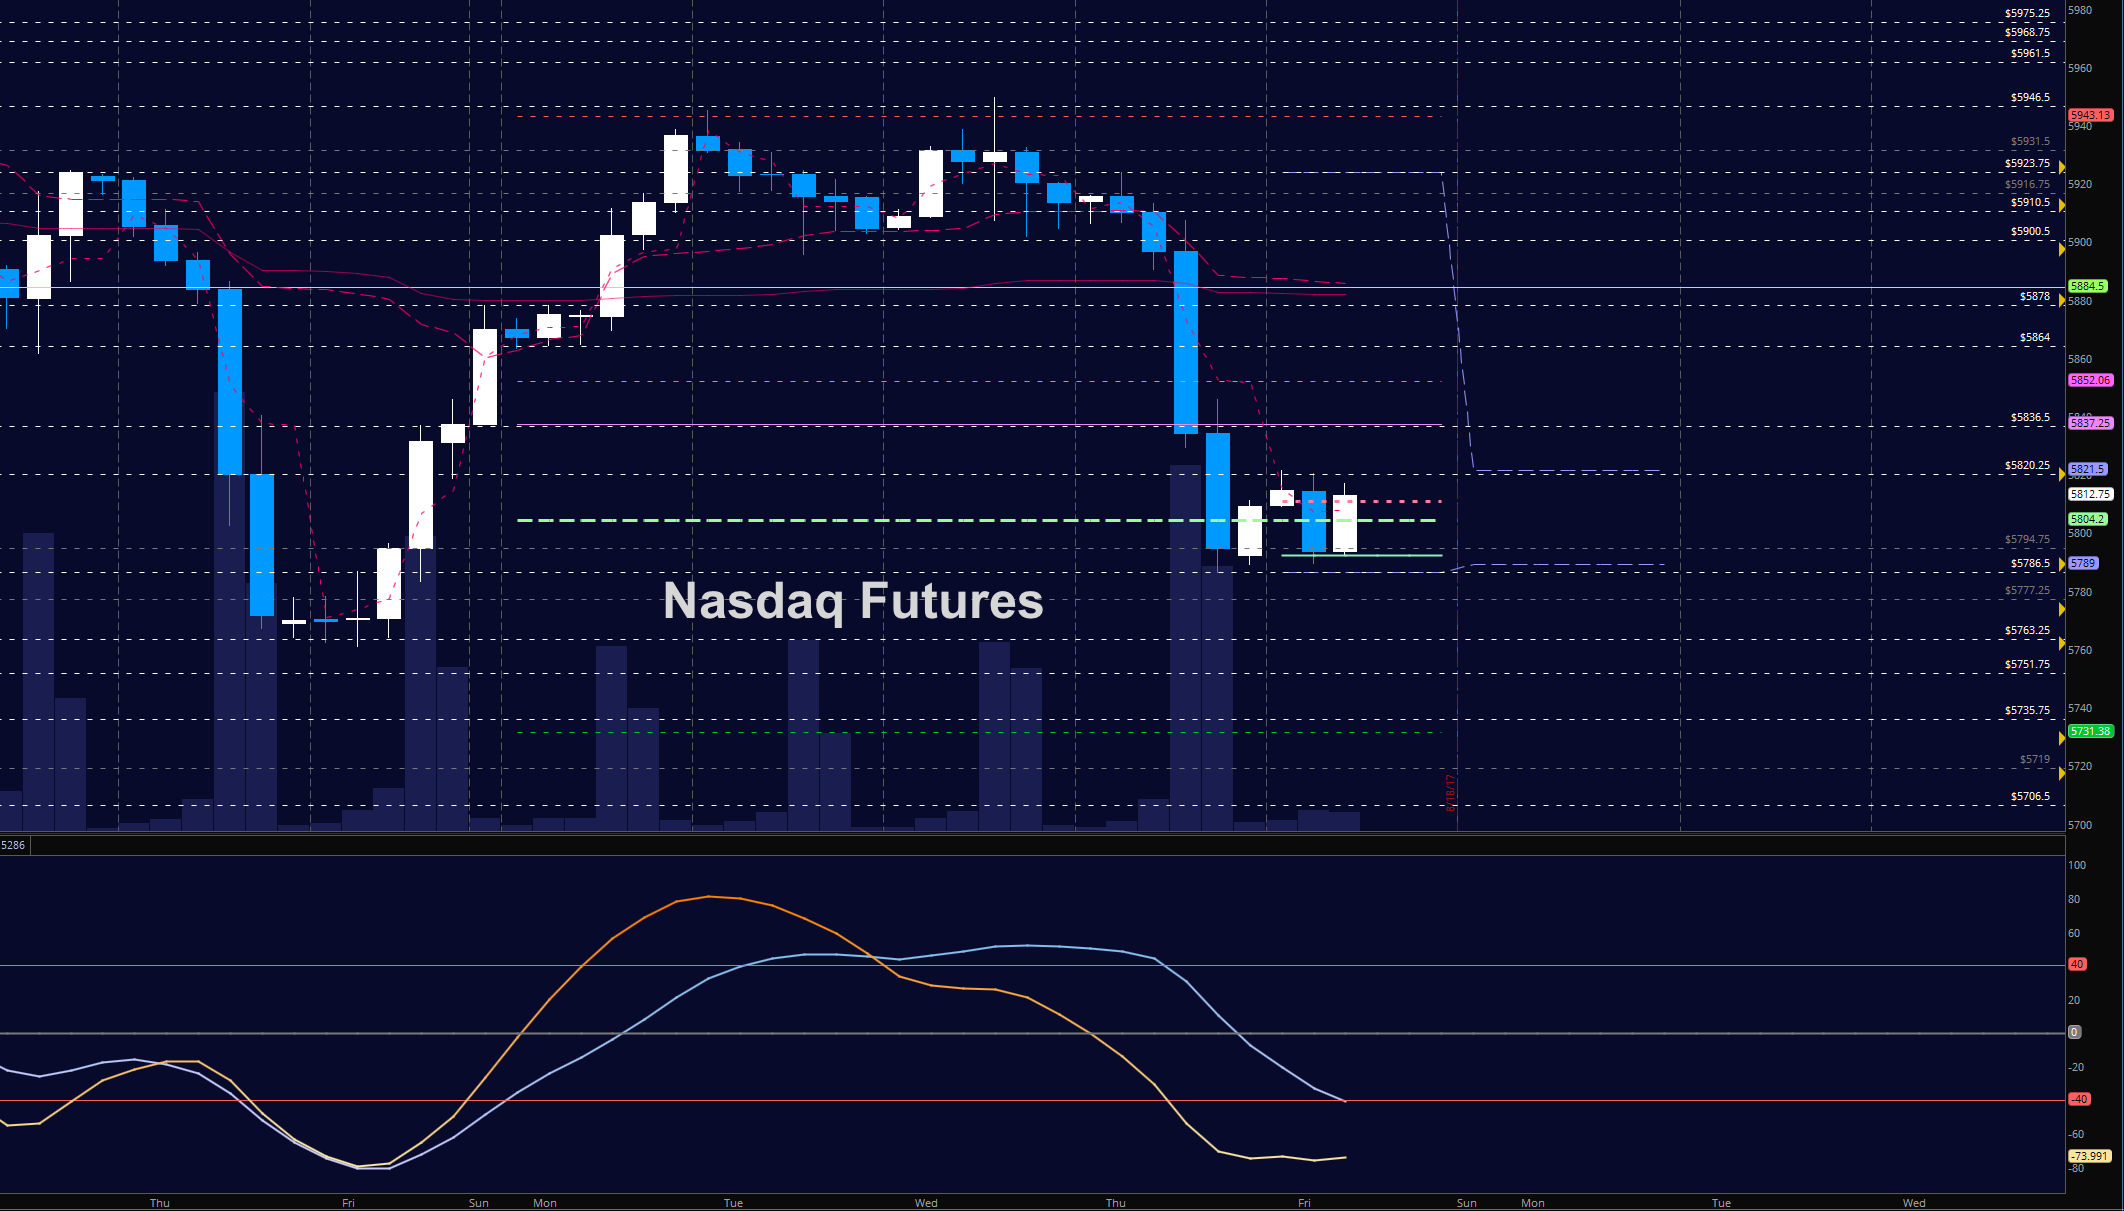
NASDAQ Futures (NQ)
Price supports are holding but sellers are preventing any advance upward. The line in the sand is now 5821 for the sellers to hold. Momentum is negative but near a tipping point. The bullets below represent the likely shift of intraday trading momentum at the positive or failed tests at the levels noted.
- Buyingpressure intraday will likely strengthen with a positive retest of 5822.75
- Sellingpressure intraday will likely strengthen with a failed retest of 5786.5
- Resistance sits near 5820.5 to 5835.75, with 5847.5 and 5884.5 above that.
- Support holds between 5790.25 and 5774.25, with 5763.25 and 5719 below that.
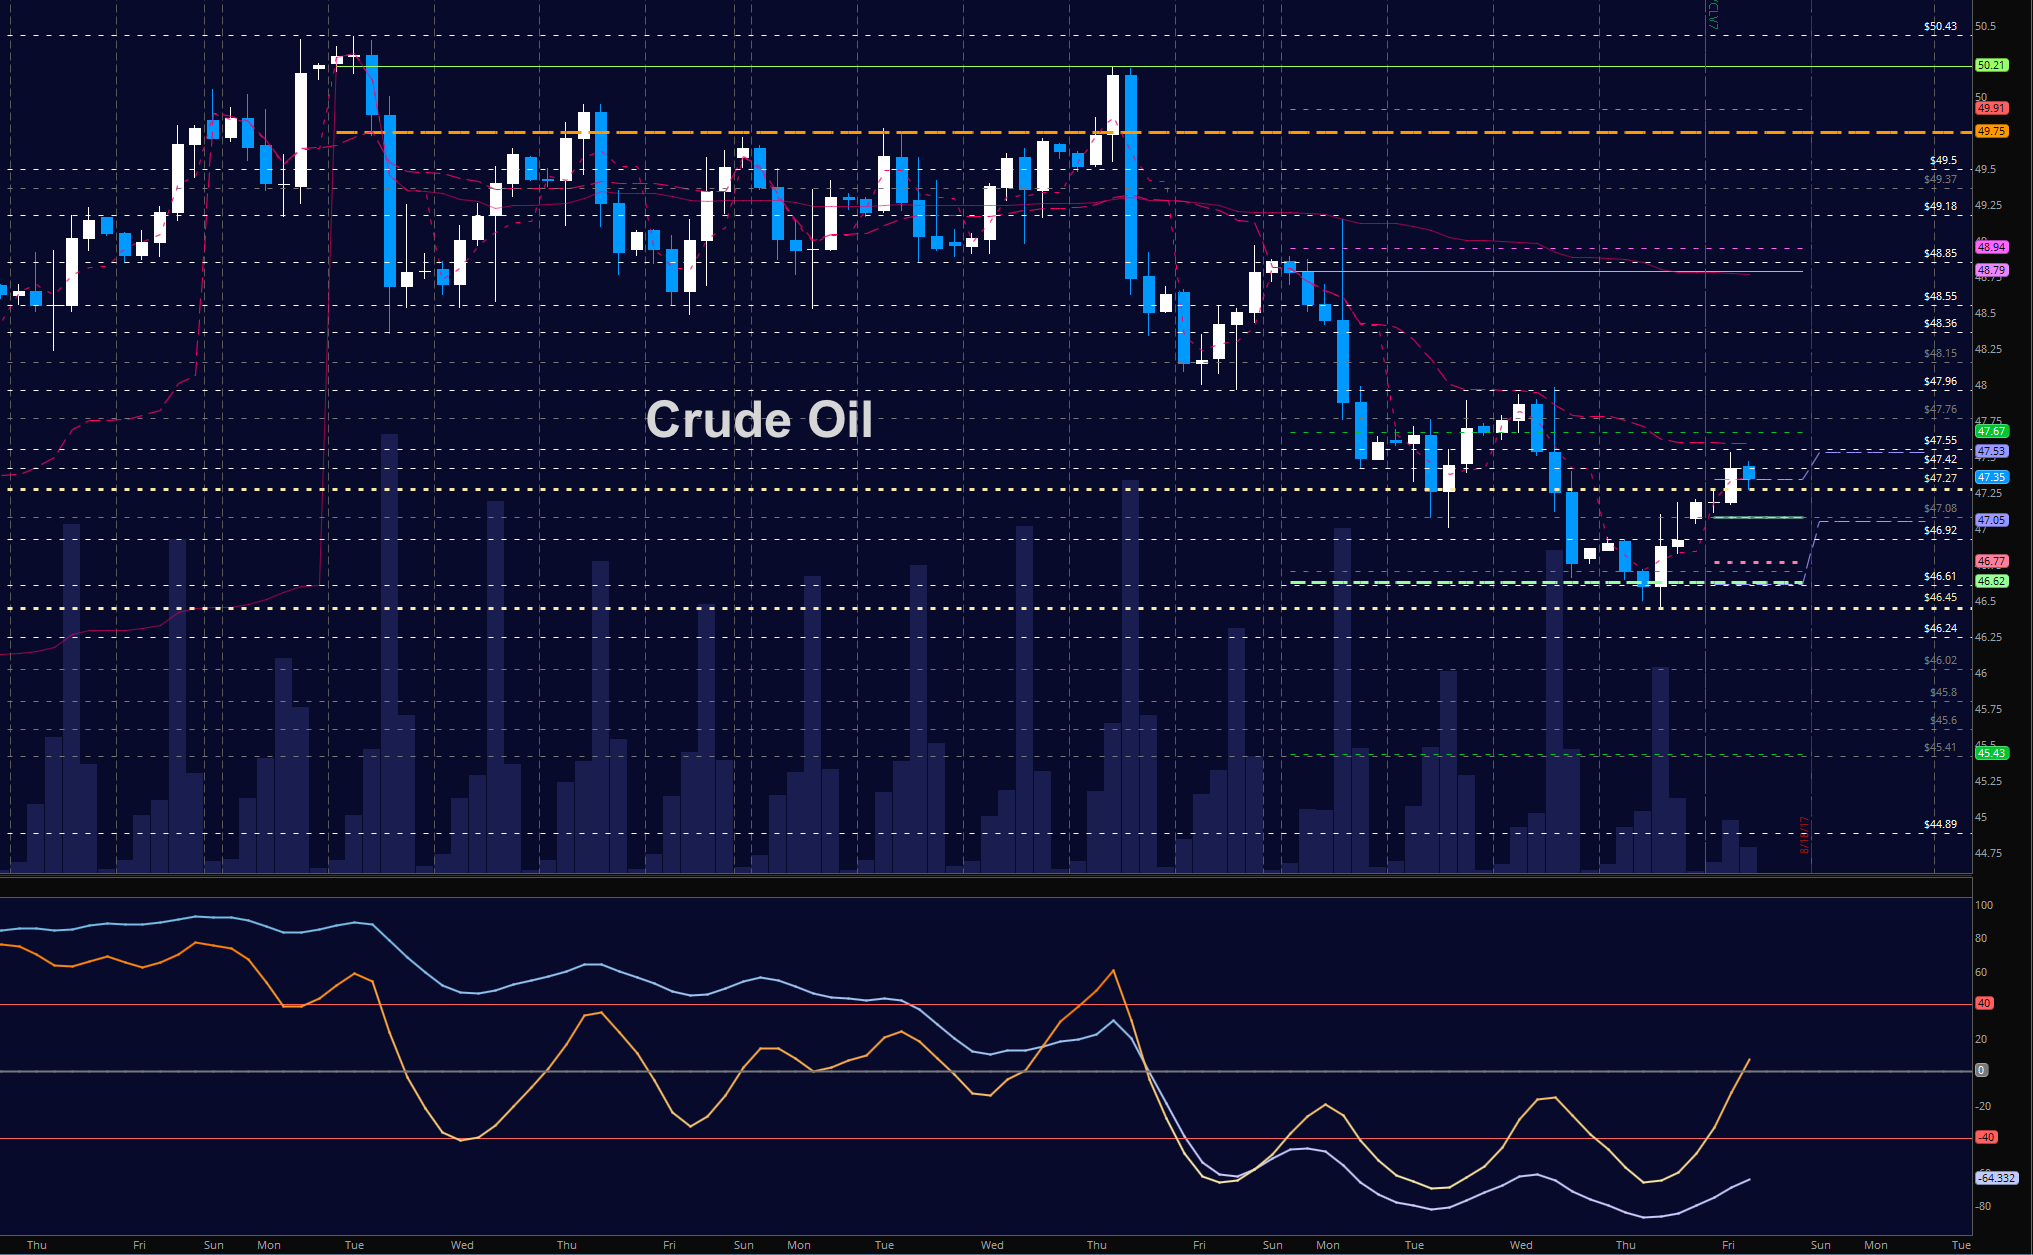
WTI Crude Oil
Deep support is holding near composite moving averages at 46.5. Bounces into resistance will still meet sellers, but higher lows will prevail if we can breach 47.6. As it stands, however, this region at 47.55 is resistance with a retest of the 46.9 area. Momentum is mixed but largely negative. The bullets below represent the likely shift of trading momentum at the positive or failed tests at the levels noted.
- Buyingpressure intraday will likely strengthen with a positive retest of 47.64
- Sellingpressure intraday will strengthen with a failed retest of 47.01
- Resistance sits near 47.76 to 48.15, with 48.36 and 48.8 above that.
- Support holds between 47.05 to 46.45, with 46.19 and 45.46 below that.
If you’re interested in watching these trades go live, join us in the live trading room from 9am to 11:30am each trading day. Visit TheTradingBook for more information.
If you’re interested in the live trading room, it is now primarily stock market futures content, though we do track heavily traded stocks and their likely daily trajectories as well – we begin at 9am with a morning report and likely chart movements along with trade setups for the day.
As long as the trader keeps himself aware of support and resistance levels, risk can be very adequately managed to play in either direction as bottom picking remains a behavior pattern that is developing with value buyers and speculative traders.
Twitter: @AnneMarieTrades
The author trades stock market futures every day and may have a position in mentioned securities at the time of publication. Any opinions expressed herein are solely those of the author, and do not in any way represent the views or opinions of any other person or entity.


