Stock Market Futures Trading Considerations For August 15, 2017
The S&P 500 (INDEXSP:.INX) is attempting to digest yesterday’s gains. A positive retest of important price support will be key for the bulls today. Continue reading below for futures trading levels for the S&P 500, Nasdaq, and crude oil.
Check out today’s economic calendar with a full rundown of releases. And note that the charts below are from our premium service and shared exclusively with See It Market readers.
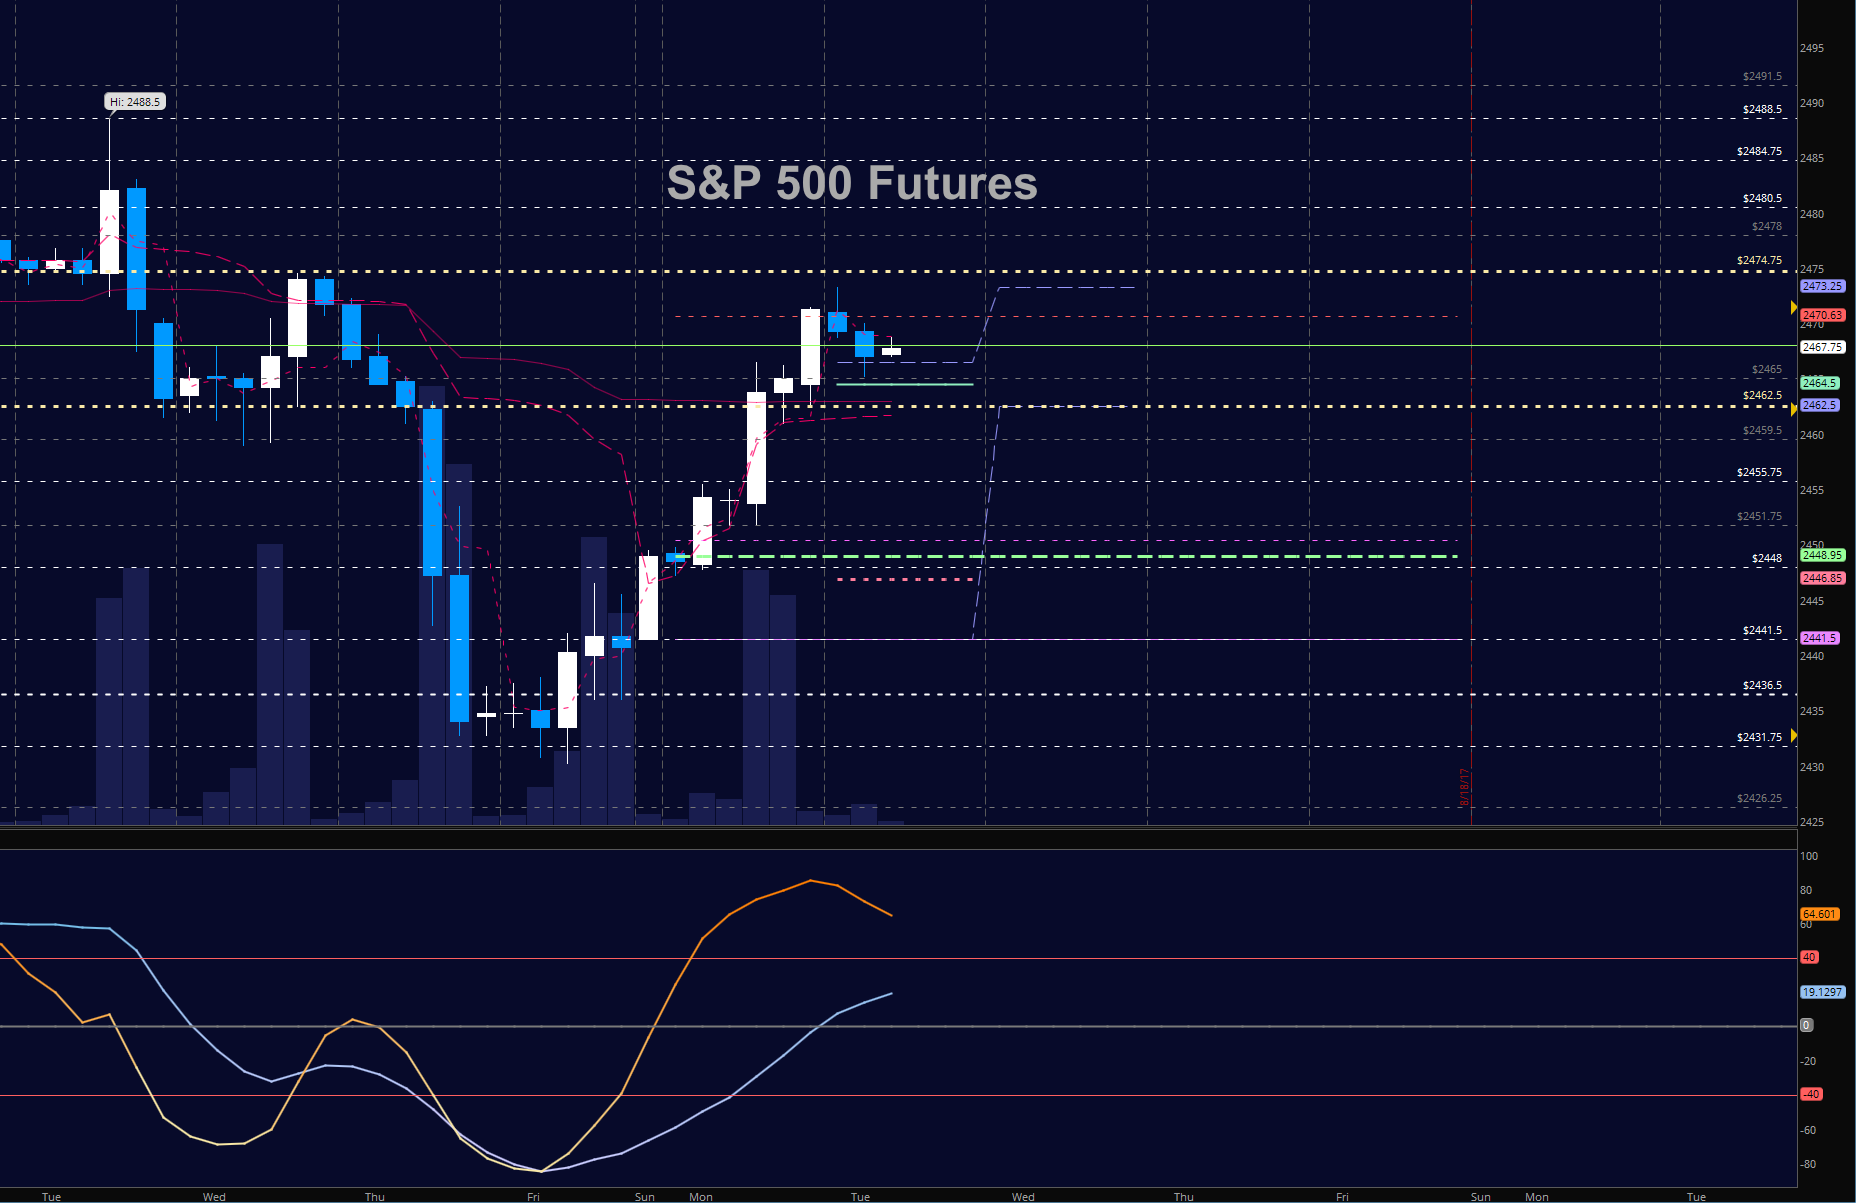
S&P 500 Futures (ES)
Bullish backdrop but into resistance levels and primary congestion. Our bounces had shallow fades confirming motion upside – but a caution sign appears as these bounces carry less volume than in times past, allowing opportunities for sellers to resume control without warning. The bullets below represent the likely shift of trading momentum at the positive or failed retests at the levels noted.
- Buying pressure intradaywill likely strengthen above a positive retest of 2474
- Sellingpressure intraday will likely strengthen with a failed retest of 2459.25
- Resistance sits near 2471.5 to 2474, with 2478 and 2482.5 above that.
- Support holds between 2459.5 and 2455.5, with 2451.5 and 2445.5 below that.
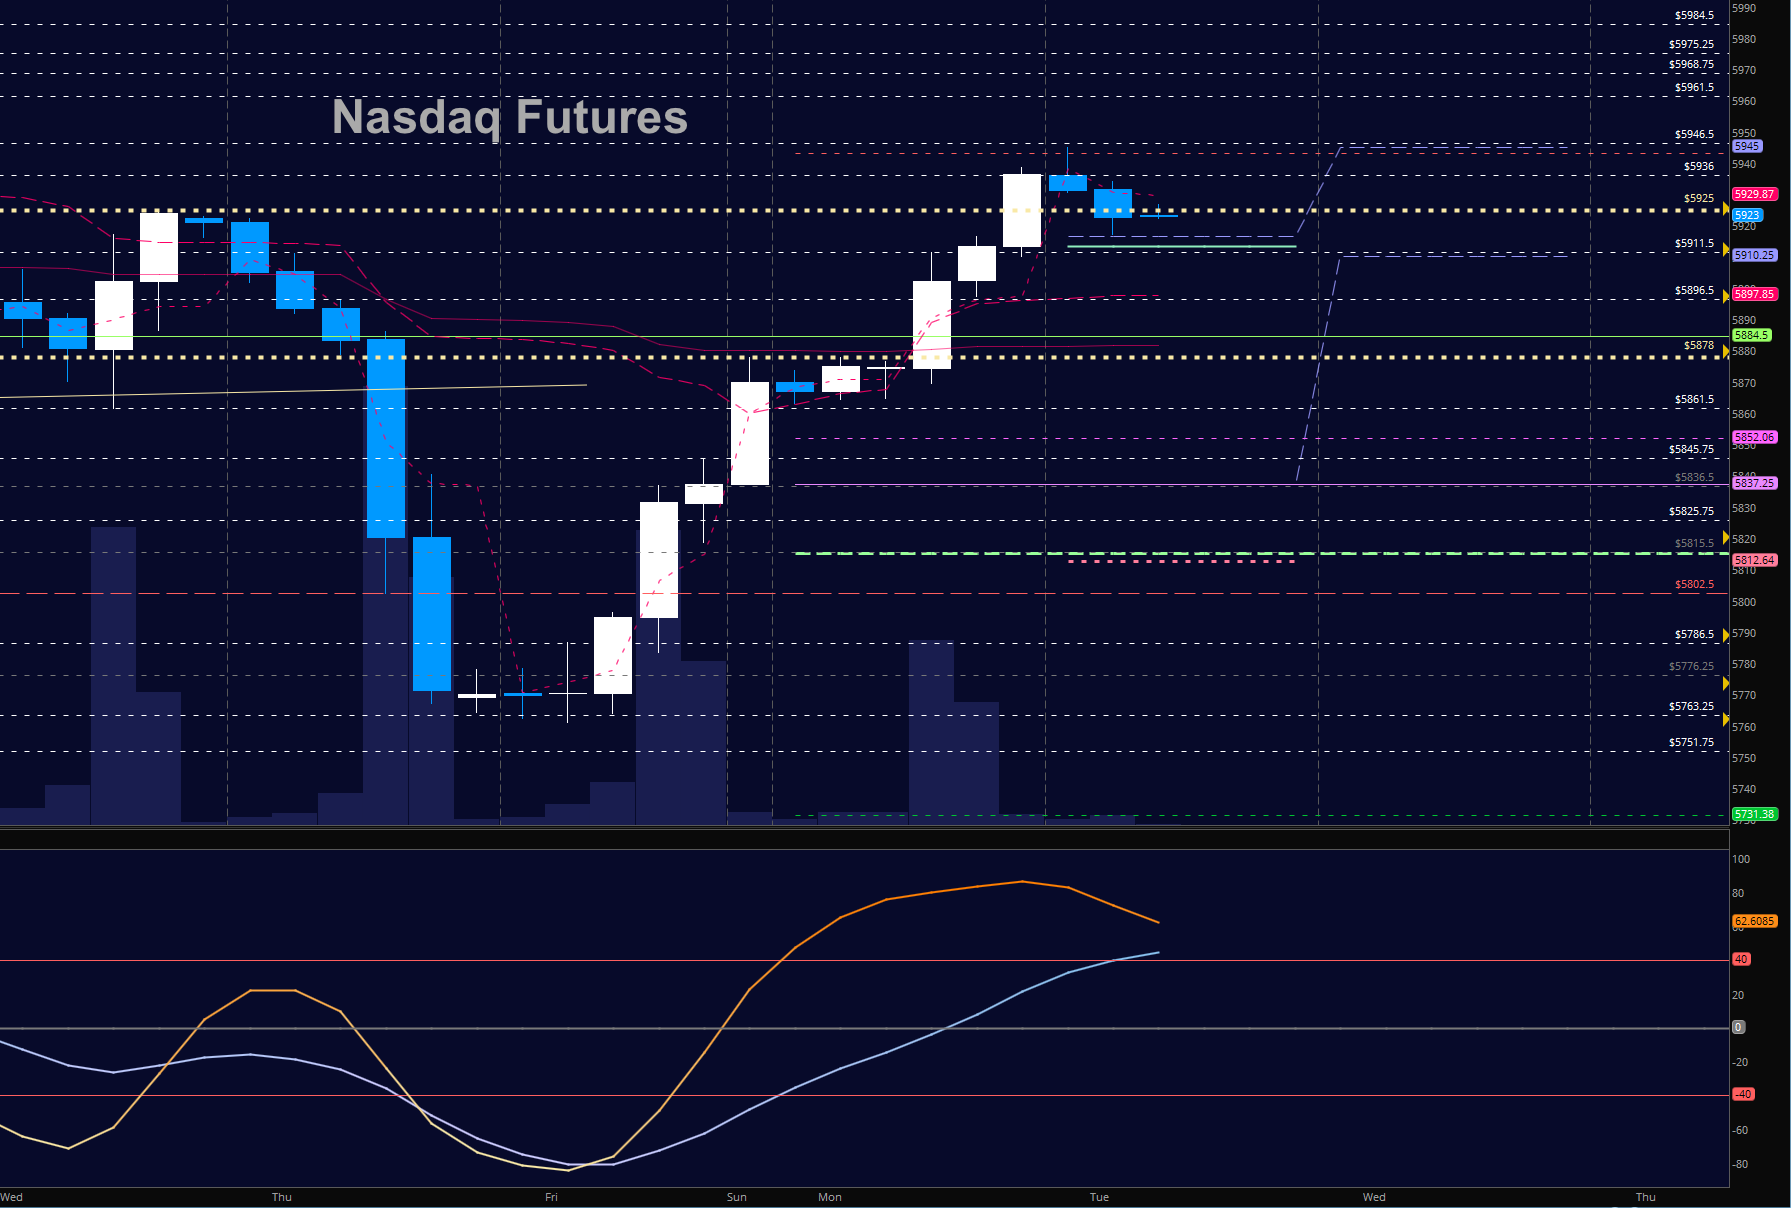
NASDAQ Futures (NQ)
Bounces hold – but resistance near 5929.75. The bullets below represent the likely shift of intraday trading momentum at the positive or failed tests at the levels noted.
- Buyingpressure intraday will likely strengthen with a positive retest of 5936
- Sellingpressure intraday will likely strengthen with a failed retest of 5898
- Resistance sits near 5929 to 5936, with 5945.5 and 5961.5 above that.
- Support holds between 5910.25 and 5898.5, with 5887.75 and 5880.75 below that.
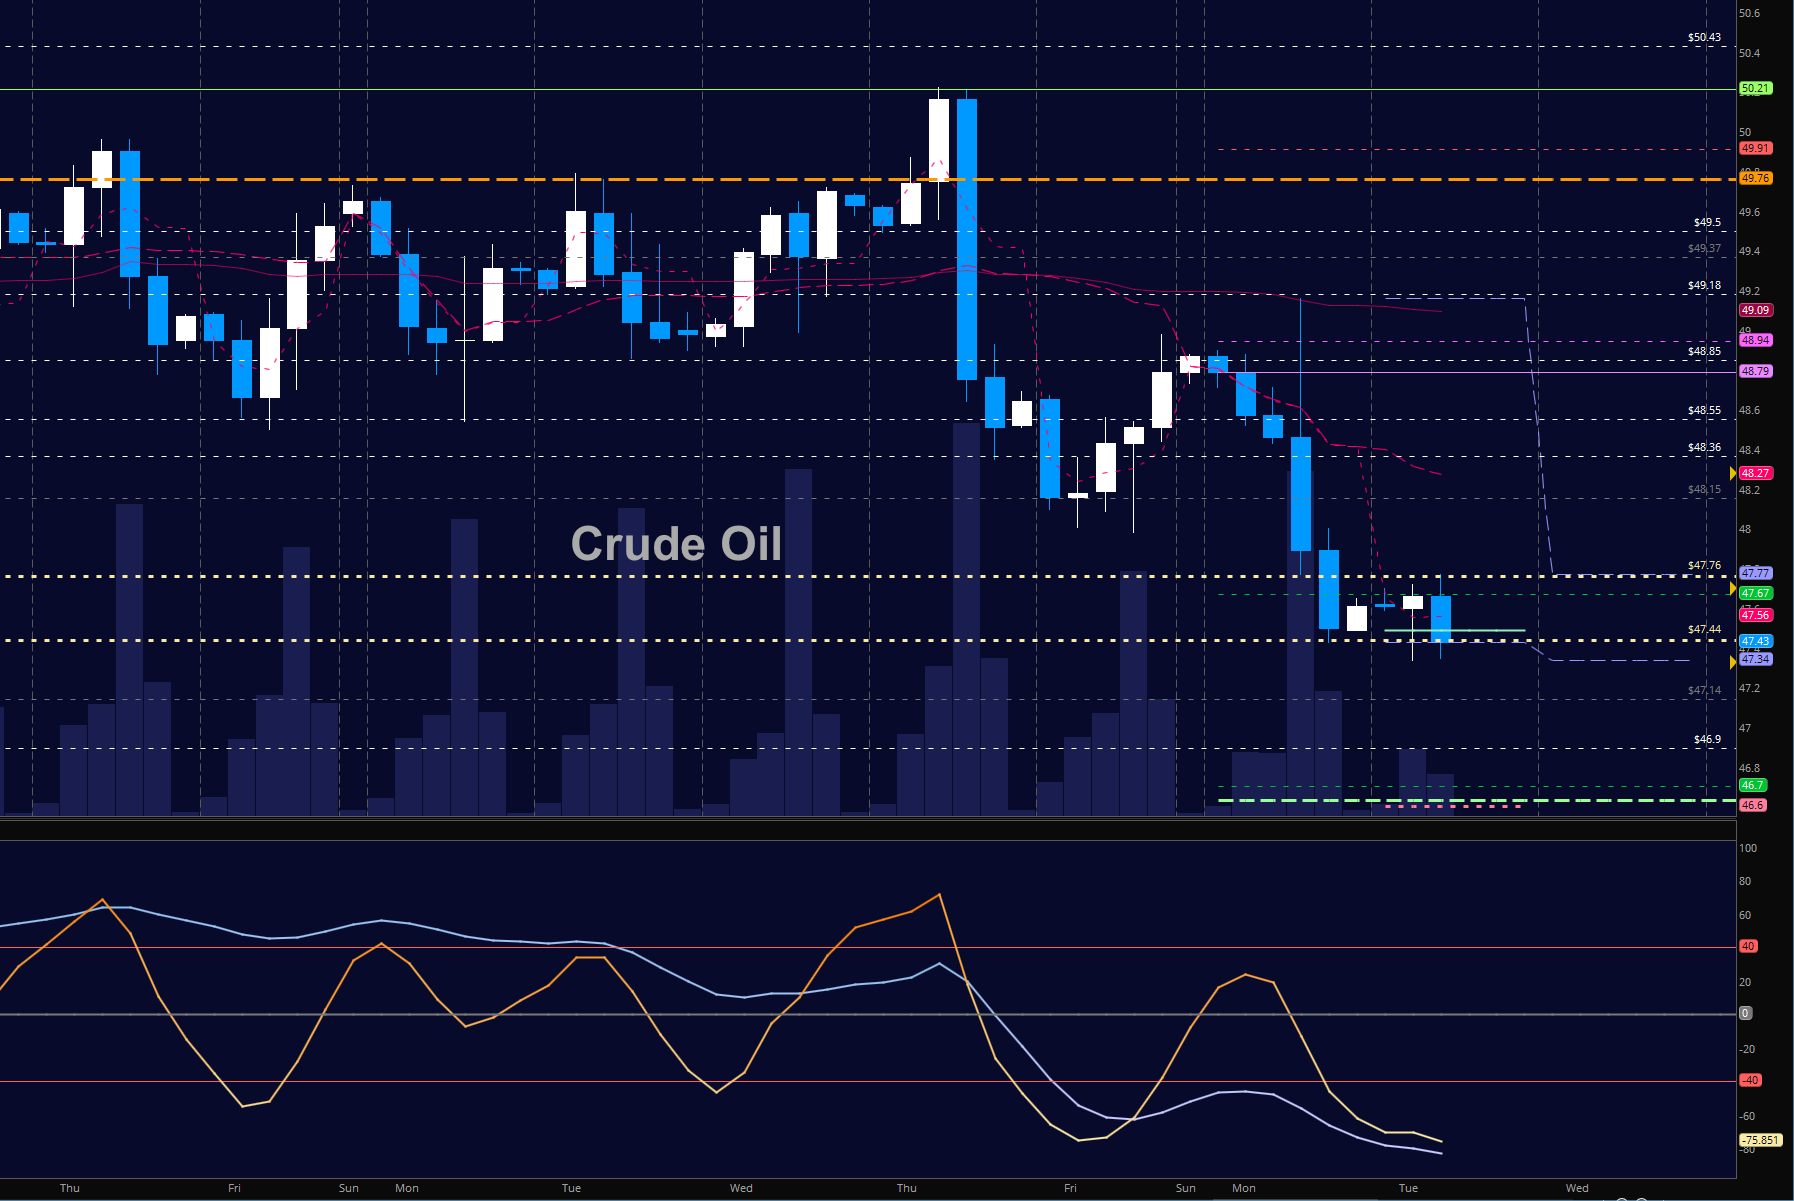
WTI Crude Oil
Support struggles to hold as traders unwind long positions ahead of API report this afternoon and the EIA report tomorrow. Momentum is quite bearish, so bounces are set to fade. The bullets below represent the likely shift of trading momentum at the positive or failed tests at the levels noted.
- Buyingpressure intraday will likely strengthen with a positive retest of 48.04
- Sellingpressure intraday will strengthen with a failed retest of 47.4
- Resistance sits near 48.22 to 48.44, with 48.79 and 49.08 above that.
- Support holds between 47.44 to 47.14, with 46.9 and 46.48 below that.
If you’re interested in the live trading room, it is now primarily stock market futures content, though we do track heavily traded stocks and their likely daily trajectories as well – we begin at 9am with a morning report and likely chart movements along with trade setups for the day.
As long as the trader keeps himself aware of support and resistance levels, risk can be very adequately managed to play in either direction as bottom picking remains a behavior pattern that is developing with value buyers and speculative traders.
Twitter: @AnneMarieTrades
The author trades stock market futures every day and may have a position in mentioned securities at the time of publication. Any opinions expressed herein are solely those of the author, and do not in any way represent the views or opinions of any other person or entity.


